
Seven weeks of sideways action on the S&P 500 large cap index has been resolved. Last Friday, the index dropped 2.5 percent, for a weekly drop of 2.4 percent. This comes on the heels of an important breakout in July.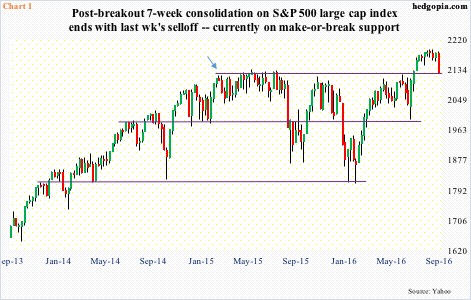
The index has essentially been going sideways since February last year (arrow in Chart 1), peaking at 2134.72 in May that year. On July 12th this year, it rallied past that high, then rallying another 2.7 percent to the new all-time high of 2193 on August 27th.
Equity bulls were hoping the consolidation was part of a continuation pattern – meaning it would eventually break with the prior trend. But signs of internal weakness were showing up.
The S&P 500 began going sideways on July 20th. On July 18th, the number of stocks above 50-day moving average peaked at 437. By last Thursday, it had dropped to 286, before dropping another 113 to 173 on Friday. Early January, this metric bottomed at 45 and at 110 on post-Brexit June 27th low.
The S&P 500 is currently sitting right on the breakout level … it is a make-or-break (Chart 1).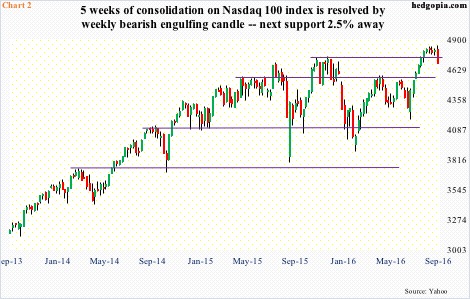
Over on the Nasdaq 100, there were similar signs of top-heavy.
Last Wednesday, the index scored a new intra-day all-time high, rising to 4839.59. Facebook (FB) and Amazon (AMZN) made fresh all-time highs last week, Alphabet (GOOGL) came very close to surpassing August’s all-time high. These three joined Apple (AAPL) and Microsoft (MSFT) in the world’s top-five list of companies by market value – all tech. For contrarians, this statistic, in and of itself, probably raises a yellow flag.
Even as the leading Nasdaq 100 names were scoring new highs, the index had been sideways since August 5th, before suffering a weekly bearish engulfing candle last week. Support at 4700 is gone (Chart 2), ditto with the 50-day moving average. Next decent support is 2.5 percent away.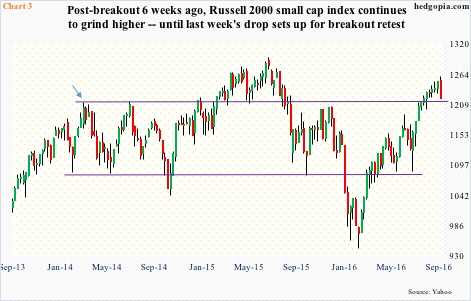
Before last Friday’s collapse, action on the Russell 2000 small-cap index was a mixed bag. On the one hand, unlike both the S&P 500 and Nasdaq 100, it continued to grind higher in recent weeks. On the other, it was yet to score a new high. On last Wednesday’s intra-day high, it was 2.8 percent from its all-time high from June last year, and is currently sitting on important breakout retest.
The Russell 2000 made an important high in March 2014 (arrow in Chart 3). This resistance was taken out in February 2015, before dropping back below in August that year. So when in July this year it managed to once again break out of it, hopes were raised that it would eventually end up making new highs. Now it is looking at a make-or-break retest.
In other words, all three indices above are sitting at/near crucial levels. The risk is to the downside.
More interesting is what led to this.
Of late, several FOMC members, including some prominent ones, have been making hawkish comments. Then came news last Friday that Lael Brainard, Fed governor, will be delivering a previously unannounced speech later today. She is a dove … has been until recently.
As had been Eric Rosengren, Boston Fed president. Also last Friday, he said the Fed risked financial instability if it kept rates anchored so low. He is a voting member. If Ms. Brainard’s speech leans hawkish, a hike this month is pretty much sealed, with maybe another in December.
This scenario obviously does not sit well with markets that pass over bad economic data rationalizing that this would deter the Fed from making a move come September.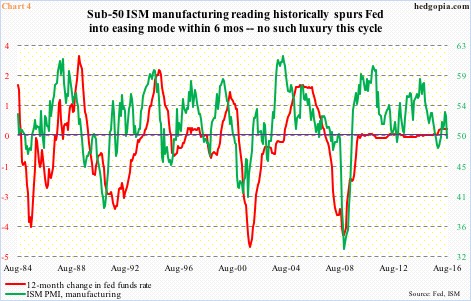
August’s ISM PMI is an example. Manufacturing fell 3.2 points month-over-month to 49.4, services dropped 4.1 m/m to 51.4. Orders respectively dropped 7.8 to 49.1 and 8.9 to 51.4. Out-and-out disappointing – possibly alarming – reports.
Incidentally, historically ISM manufacturing below 50 has tended to jolt the Fed into action. For five months between October last year and February this year, the green line in Chart 4 did remain sub-50. Once again, it has slipped below that threshold.
However, the fed funds rate has remained zero-bound since December 2008. There was one 25-basis-point hike last December, and that is it. The Fed probably realizes the need to fill its monetary quiver with arrows, but data at best is mixed. Job creation is decent, but not all other data are in sync.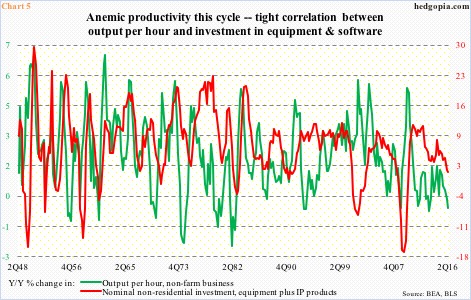
Perhaps one of the most glaring shortfall is lackluster productivity (Chart 5). On a quarter-over-quarter annualized basis, output per hour has shrunk for the last three quarters. Annually, 2Q16 fell 0.6 percent – the first year-over-year contraction since 2Q13; the last time it grew north of three percent was in 2Q10.
Productivity is moving hand in hand with trends in non-residential investment. In 2Q16, nominal equipment plus IP products totaled $1.81 trillion (seasonally adjusted annual rate), having peaked at $1.82 trillion two quarters earlier. Annually, the growth rate decelerated to 1.3 percent in 2Q16 from as high as 11.7 percent in 2Q12.
This kind of data has given the Fed an excuse not to get off the zero-bound, and equity bulls expect this to continue. Conditions are overbought, and sentiment complacent. But the sideways move in the S&P 500 was expected to resolve in an upside breakout. For this to occur, new money needed to come in.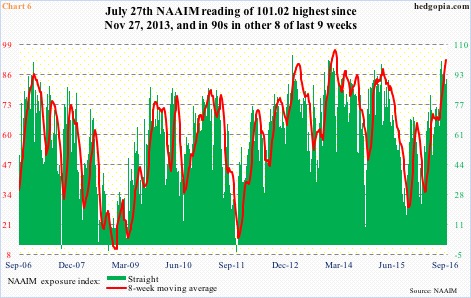
Last week, Investors Intelligence bulls were 52.5 percent (bears were 22.8 percent). This was the ninth straight week of bulls north of 50 percent. For the same week, the National Association of Active Investment Managers exposure index read 92.3. The index represents members’ average exposure to U.S. equity markets.
In the July 27th week, the green bars in Chart 6 jumped to 101.02, which was the highest since November 27, 2013. Readings have remained elevated for the last several weeks, with eight of the last nine in the 90s or higher. These managers are all in. The risk going forward is when they decide to leave.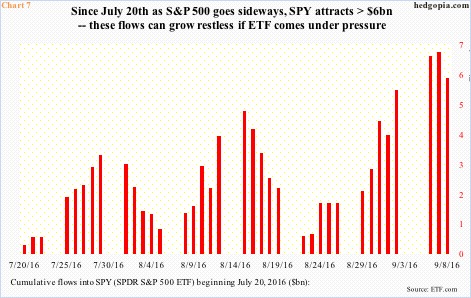
The S&P 500 began to go sideways on July 20th. Since then, north of $6 billion has moved into SPY, the SPDR S&P 500 ETF. These flows have stayed put because of (1) sideways index/ETF, and/or (2) optimism that a breakout occurs. Now that the index broke to the downside, the ETF runs a risk of these flows leaving. The red bars in Chart 7 are as of Thursday last week. Given Friday’s sell-off, it may have already witnessed outflows. We will find out.
The good thing – if it can be called that – in Friday’s selling is that all this took place on a Friday. Weekend may help soothe investor/trader nerves … or not. A potentially bad aspect to all this is that this may coax profit-taking. Trough-to-peak, the S&P 500 rallied 21 percent since the February lows. Given Fed-related uncertainty in the next eight sessions, why not lock in profits?
The Brainard speech later today will be a good barometer to measure the pressure stocks may come under near term. In fact, how they behave between now and Sep 20-21 can potentially impact what gets decided in that meeting.
Thanks for reading!
