
Today is jobs day. At 8:30 later this morning, the Bureau of Labor Statistics publishes the report card for September. A monthly ritual that markets more often than not await with abated breath. Particularly so this time around as the Fed, which just two weeks ago decided not to hike, supposedly is so close to hiking. Hard to fathom how one month’s data can be a make-or-break for any decision-making!
Besides, these numbers are prone to revision. When August was reported, both June and July were revised upward by a cumulative 58,000 Jobs. This Wednesday, ADP said U.S. private-sector businesses added 200,000 in September, even as August was revised lower by 4,000, to 186,000.
Regardless, markets will be on pins and needles and will probably react to the September print – one way or the other. The consensus currently expects 200,000.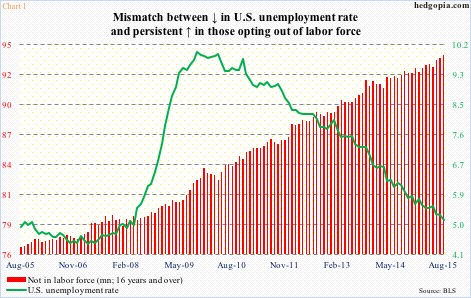
The Fed, on the other hand, is less likely to be swayed by one month’s data. We hope not. Trend is what matters. And on this front, even within jobs, it is mixed at best.
If we were to just focus on the unemployment rate, it is a no-brainer. With 5.1 percent unemployment rate in August, the labor market is tightening – a lot tighter than when unemployment was 10 percent back in October 2009 – portrayed by the green line in Chart 1. The red bars portray a different picture. The number of Americans opting out of the labor force continues to grow – 94 million in August. This suggests slack.
In August, 173,000 non-farm jobs were added – weaker than the eight-month average this year of 212,000. The average last year was 260,000. Momentum is weakening. Chart 2 plots the monthly change in non-farm payroll and its six- and 12-month moving averages. In the four months through August, the six-month average has crossed below the 12-month. Once again a sign of decelerating momentum.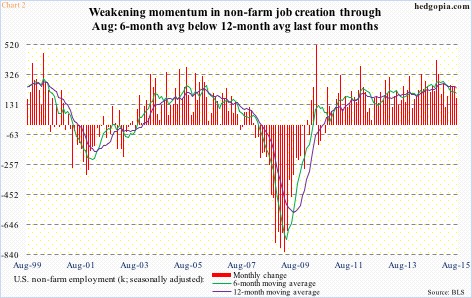
The good thing in all this is that energy probably played a role in the weakening jobs momentum and that the sector is beginning to show some stability. In the first three quarters this year, job-cut announcements in the sector amounted to 72.7k, versus 10.3k in the comparable period last year. The 12-month average peaked at 78.5k in July, with September at 76.7k. September only saw 1.1k job cuts, down from 9.1k in July (Chart 3).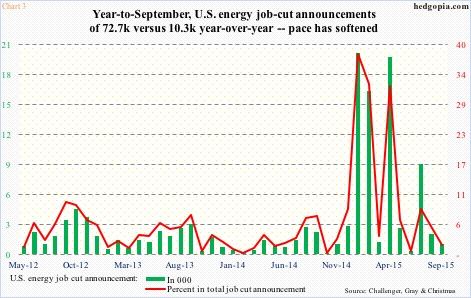
It is possible the pace of job cuts in energy has softened as oil tries to stabilize. The spot West Texas Intermediate crude closed below $40/barrel in three consecutive sessions in late August before rebounding to the 40s ($45.02 on Thursday). What happens to oil price is bound to have repercussions for jobs – energy and overall.
Just this Tuesday, Chesapeake Energy (CHK) said it plans to slash about 15 percent of its workforce, or 740 employees.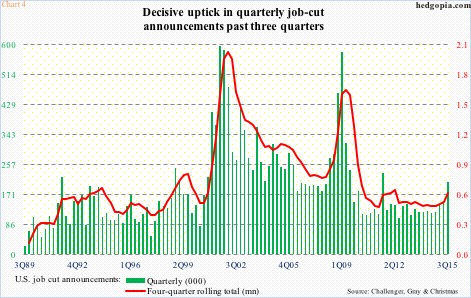
Here is the thing. When deciding on lending standards for oil and gas companies, banks not only focus on reserves but also on production. U.S. crude production is still north of nine million barrels a month, but it also peaked at 9.61 million in the June 5th week. In all probability, lending standards are set to tighten, it is just a matter of by how much.
How all this shakes out can have implications for Chart 4. In it, the green bars represent quarterly job-cut announcements, while the red line is a four-quarter rolling total. First of all, in a larger scheme of things, they remain low. But once again, it pays to pay attention to the trend. Job-cut announcements have risen from 117.4k in 3Q14 to 205.8k in 3Q15, and the four-quarter rolling total from 483.2k in 4Q14 to 613.2k in 3Q15. The rather sharp rise in the green bars the past three quarters in particular is noticeable. Granted the 3Q15 total was heavily influenced by July’s 105.7k (versus 41.2k in August and 58.9k in September), the trend nonetheless is up.
Something worth a close watch!
Thanks for reading!
