
The S&P 500 large cap index was flat in March. Foreigners only purchased $876 million worth of U.S. stocks in that month.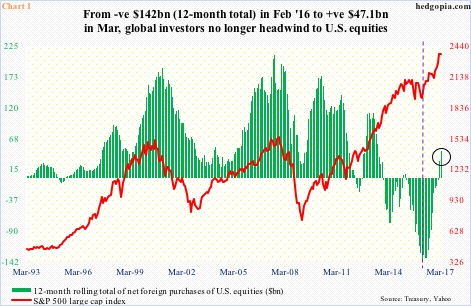
Of late, they have been more of a tailwind than a headwind.
The 12-month rolling total of foreign purchases of U.S. equities was $47.1 billion in March. In February last year, they were selling as much as $142 billion worth – a record.
The green bars in Chart 1 bottomed in that month, followed by progressive improvement. In that same month, the S&P 500 reached a major bottom (denoted by dashed vertical line in Chart 1).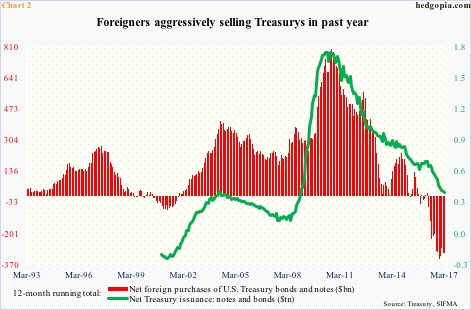
Foreigners’ enthusiasm for U.S. equities is not matched in Treasury securities, which they have been selling.
In March, the 12-month rolling total of net foreign purchases of U.S. Treasury notes and bonds totaled minus $308.6 billion – only slightly less than record selling of $339.3 billion last November (Chart 2).
Selling picked up momentum early last year even as the Treasury began issuing lesser and lesser notes and bonds. In March, the 12-month rolling total of Treasury issuance totaled $353.5 billion, versus $654.4 billion in February last year.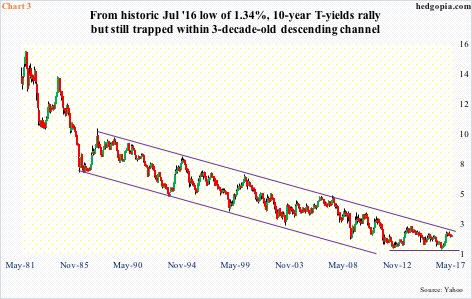
Early last year when foreigners’ selling of Treasurys began to accelerate, 10-year T-yields were under pressure. Yields eventually bottomed at 1.34 percent in July last year – successfully testing the lows of four years ago.
Yields (2.33 percent) have risen from that trough, but are still stuck in a three-decade downtrend.
In December last year and March this year, 10-year yields retreated from 2.62 percent. This (2.6 percent) is Janus Capital’s Bill Gross’s line in the sand. To him, a breakout would signal an end to the bull market in bonds (on the price side). For Jeff Gundlach, of DoubleLine Capital, this would occur with yields north of three percent. This is where the downtrend channel in Chart 3 will be broken.
It seems foreigners are not waiting until that happens.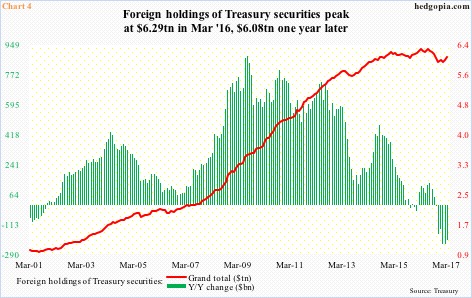
As of March, they held $6.08 trillion in Treasury notes and bonds. The all-time high of $6.29 trillion was reached in March last year (Chart 4). That is a decline of $207.2 billion. At least some of this money likely made its way into U.S. equities, but not all. Because there is another variable in this equation, and that is China.
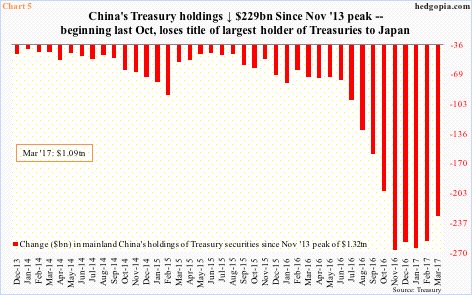
China and Japan are the two largest holders of Treasury securities – respectively at $1.12 trillion and $1.09 trillion in March. They have also been cutting back.
Back in November 2014, Japan held as much as $1.24 trillion worth, and China $1.32 trillion in November 2013. Apparently, the latter has been cutting back at a brisker pace.
Off the November 2013 peak, China’s holdings have declined by $229.1 billion (Chart 5). Between February last year and January this year, they fell north of $200 billion. This was also a period China’s foreign-exchange reserves were under pressure as it was having to defend the yuan/stop capital outflows.
Reserves are now back above $3 trillion – up $21 billion in April to $3.03 trillion and a third straight month of increase. Rules on moving capital outside the country have been tightened. China’s Treasury holdings went up by nearly $37 billion in February and March.
Thus, most of the drop in the red bars on the right side of Chart 2 is probably China-related, and likely did not make it into U.S. equities. In other words, rotation has not yet occurred.
Despite this, the fact that foreigners have of late been a source of funds for U.S. equities should hearten the equity bulls. With the bull market in its ninth year and other sources of funds struggling to keep up, the latter need it.
Thanks for reading!
