
Spot gold fell 0.45 percent last week – its fifth consecutive down week. Over the past two weeks, the rate of decline has softened.
But that is small consolation to gold bugs that have been at the losing end of the stick for the past four years.
The yellow metal peaked in September 2011, ending a multi-year rally that began in July 1999. Since that peak, gold has had several countertrend rallies, but the major trend has been down. It is too soon to say if we are nearing an end to that, but it is a good spot to pause/stop the downtrend.
Gold has retraced one half of the July 1999-September 2011 surge. Ordinarily, this is a good spot for gold bugs to put their foot down. That said, they do not have an easy task.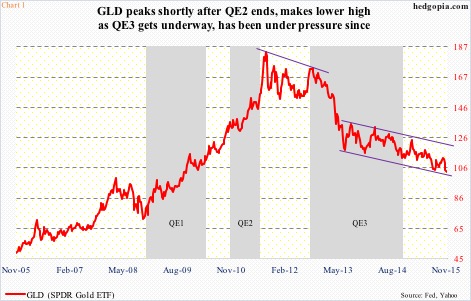
At the present, gold is out of fashion. As a matter of fact, when it peaked in September 2011, QE2 (U.S.) had just come to an end. Later in September 2012, QE3 began, but gold never got its luster back. It made a lower high (Chart 1).
Fast-forward to the present, the metal bottomed early August this year and rallied nearly eight percent in two months.
Non-commercials, who had earlier reduced net longs in gold futures to 24,465 contracts in late July began to add even as the metal began to rally, peaking at 157,434 contracts in late October. They have been cutting back the past three weeks. As of Tuesday last week, they only held 34,399 contracts (Chart 2). This is the lowest since the middle of August. These traders are probably just about done selling – unless gold comes in for another round of selling.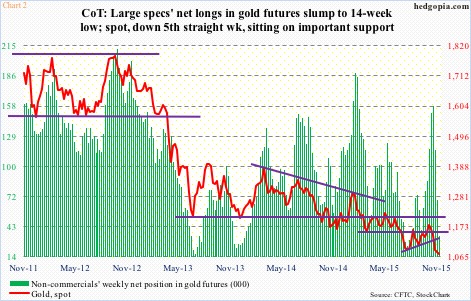
Hence the significance of where gold trades right now.
As is seen in Chart 3, GLD, the SPDR Gold ETF, has been pushed down by a downtrend line for over two years now, resulting in loss of support at first $114 and then $110. Most recently, the July (this year) low was briefly undercut as well.
It is tough to get bullish on gold. This is one aspect.
Here is the other side. As stated previously, despite non-commercials reducing their net longs by 78 percent in the past three weeks, gold is hanging in there. Still clinging on to support, but not collapsing. Besides, post-release of October 27-28 FOMC minutes last week, the two-year yield ended the week at 0.93 percent, up from 0.57 percent in the middle of October. Markets are acting as if a hike in December is a given. Gold is not falling apart – still clinging on to support.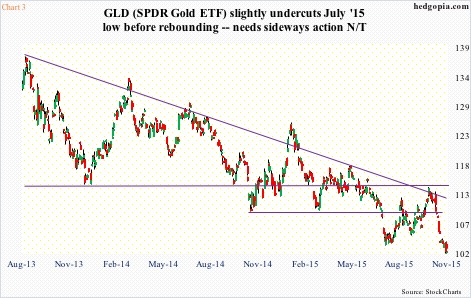
On a daily chart, GLD is way oversold. On a weekly chart, it is likely to soon get there.
Near-term, the odds of the ETF meandering along are decent. Should that happen, it will have created a nice base for the next leg higher – however long it lasts. The key thing is that it needs to go sideways before shorter-term averages begin to hook up.
Given all this, here are three hypothetical scenarios to play this.
1. Go long. That’s it. Bite the bullet. Friday, GLD closed at $103.09.
2. Deploy weekly short puts. November 27th 102.50 puts bring $0.49. If put, it is a long at $102.01. If the underlying rallies, the premium is kept.
3. Do a buy-write. In this, GLD is purchased, and calls are simultaneously sold against it. November 27th 103.50 calls sell for $0.54. If the underlying rallies past the strike, it will be assigned for an effective price of $104.04, for a profit of $0.95. If GLD comes under pressure/goes sideways, the cost effectively drops to $102.55.
Obviously in scenario (3), the profit potential is limited should GLD rally substantially this week – possible, but not probable. The ETF is in need of sideways move. Should that happen, scenario (3) makes the most sense.
Thanks for reading!
