
Gold bugs were simply swamped with an avalanche of sell orders on Tuesday, with spot gold losing 3.3 percent. This was probably in the making.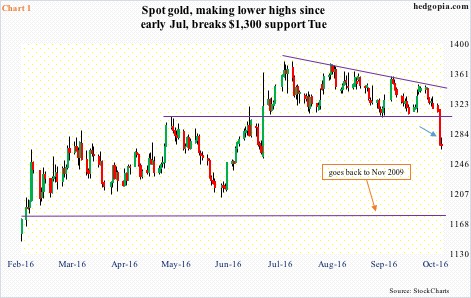
Ever since spot gold peaked at $1,377.5/ounce on July 6 this year, it had been making lower highs. Since that high, support at $1,300 had already been tested three times on the daily chart. Tuesday was the fourth, and the metal gave way (blue arrow in Chart 1).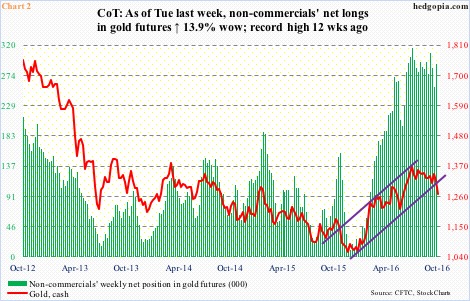
It is possible non-commercials materially reduced net longs in gold futures. Holdings as of Tuesday will be reported tomorrow. By Tuesday last week, net longs rose 13.9 percent week-over-week to 291,904 contracts. Earlier on July 5, holdings rose to a record 315,963 contracts; the spot peaked a day later. Even though spot gold had been trending lower, these traders had essentially been holding on to their net longs; probably because the $1,300 support was still holding. That was no longer the case this Tuesday.
GLD, the SPDR gold ETF, at the same time was beginning to struggle to attract funds. Since July 5 through this Monday, the ETF lost $498 million. The metal bottomed on December 3 last year at $1,045.4. Since that low through July 1, GLD attracted north of $8 billion. Gold’s sideways/slightly down price action the past three months was probably testing GLD longs’ patience to either lock in profit or cut losses.
This probably took place Tuesday. The main catalyst was, of course, the loss of that support at $1,300, aided by others.
Since the ISM report this Monday (manufacturing up 2.1 points month-over-month to 51.5 in September), the US dollar index has rallied – also responding to hawkish comments from some FOMC members.
Jeffrey Lacker, the Richmond Fed president, said Tuesday he would have voted for an interest rate hike at the September meeting had he been able to vote. On Monday, Loretta Mester, president of the Cleveland Fed, said the November 1-2 meeting should be viewed as live for a policy decision. (The U.S. presidential election is on November 8.) Ms. Mester was one of the three voters to dissent at the September meeting.
To add salt to the wound came a Tuesday Bloomberg report that the ECB may start tapering its bond buying program (later denied by ECB officials, by the way). Gold pines for easy monetary policy.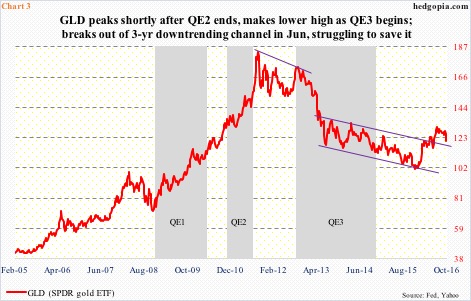
To refresh, gold/GLD did very well during QE 1 and 2, but peaked in September 2011, shortly after QE 2 came to an end. As QE 3 got underway in September 2012, the metal made a lower high, and never recovered throughout QE 3 (Chart 3).
The 3.3-percent drop on Tuesday was the largest since June 26, 2013, when it fell 4.1 percent. With this, the metal has broken the rising trend line from early December last year (Chart 2).
There is major support at $1,180, which goes back to November 2009 (Chart 1). For that to come into play, gold ($1,268.6) has to drop another seven percent … not likely near term. Immediately ahead, the 200-day moving average lies at $1,255.33, which is one percent away. The corresponding support on GLD ($120.78) lies at $119.76 – 0.8 percent away. This support likely gets tested near term, and is unlikely to give way at the very first try.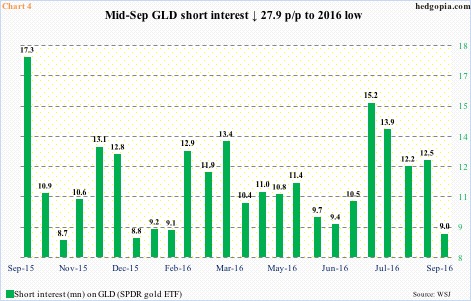
That said, at least near term, short squeeze is unlikely to be a factor. Mid-September GLD short interest fell 28 percent period-over-period to just under nine million – the lowest since the end of December last year. Back then, at the end of November, short interest stood at 13.1 million. Gold bottomed early December, squeezing shorts; in the next month, short interest dropped to 8.8 million. Right now, short interest may not help the metal, but right here and now the odds of a breach of the 200-day moving average look slim.
One way to play this scenario is by deploying a short put. Hypothetically, October 14th 120.50 puts bring $0.96. It is naked, so if assigned, it is a long at $119.54. Unassigned, it is decent premium to keep.
Thanks for reading!
