
At first glance, Charts 1 and 2 look identical. With a slight difference. The red line is represented by the S&P 500 large cap index in both. The green bars are different.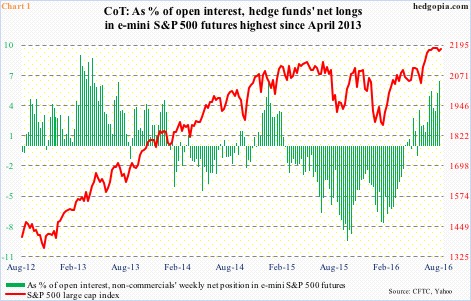
In Chart 2, these bars represent non-commercials’ weekly net position in e-mini S&P 500 futures. In Chart 1, they constitute these traders’ net position as percent of open interest. For instance, in the latest period, net longs were 192,370 and open interest 3,004,043, resulting in 6.4 percent.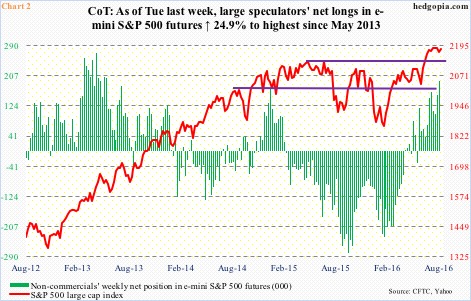
In late April this year, non-commercials switched to net long e-mini S&P 500 futures for the first time in a while. That is when the green bars in Chart 1 switched to positive territory, and continued to rise, as did net longs in Chart 2. By last Tuesday, these net longs were the highest since early June 2013; similarly, as percent of open interest, they rose to the highest since late April 2013. Directionally, the green bars in both charts are moving hand in hand.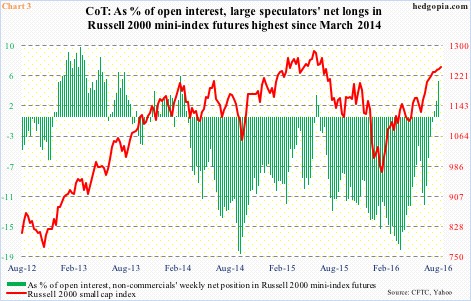
Or for that matter Charts 3 and 4. Both charts use the Russell 2000 small cap index. Chart 4 uses non-commercials’ weekly net position in Russell 2000 mini-index futures, Chart 3 these traders’ net position as percent of open interest. Just the way Charts 1 & 2 are, the difference is the index.
As is the case with Charts 1 and 2, the green bars in Charts 3 and 4 directionally look identical. For the first time since June last year, non-commercials switched to net long three weeks ago, as did the share of net position in open interest.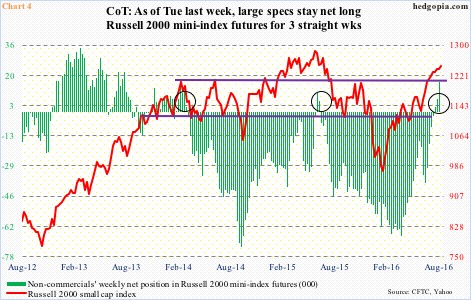
Open interest is the total of all contracts entered into and not yet offset by a transaction, by delivery, by exercise, etc.
In general, rising open interest accompanied by rising price is considered bullish … essentially means new money is jumping on the rally bandwagon. We are witnessing this in Nasdaq 100 index (mini) futures.
As of the week ended June 28th, open interest on Nasdaq 100 index (mini) futures was 206,056 contracts, rising to 297,330 last week. Post-Brexit, U.S. indices bottomed on June 27th. In the corresponding period, open interest on e-mini S&P 500 futures rose only slightly from 2,950,885 contracts to 3,004,043; on Russell 2000 mini index futures, it dropped from 343,338 contracts to 334,673. In general, if the price is increasing but open interest is not, this suggests short-covering.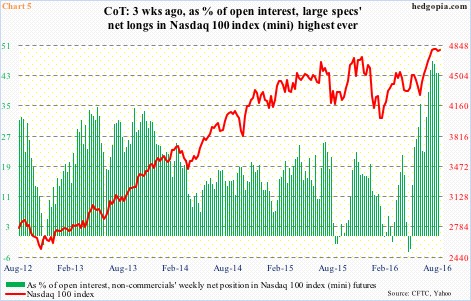
There is something else going on in Nasdaq 100 open interest. The green bars in Charts 5 and 6 do not look identical, the way they do in Charts 1 and 2 and in Charts 3 and 4. Non-commercials’ August 2nd holdings in Chart 6 were the highest since November 2013; but at 46.3 percent, the share of net longs in open interest was the highest ever (Chart 5).
In other words, these traders’ net longs comprise an increasing amount of open interest. At what point does this become lop-sided? Or at what point does the wagon become overcrowded?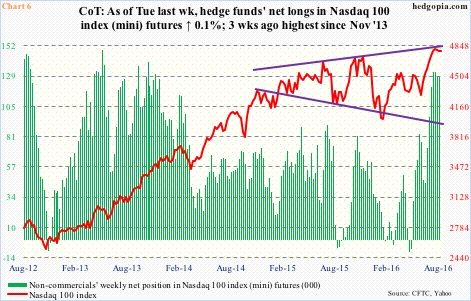
By nature, unlike commercial traders who use the futures market to offset risk in the cash market, non-commercials do so for investment or speculative purposes. The risk pertaining to the green bars in Chart 5 is that the balance is beginning to tilt on one side – rather heavily. When the scales get balanced, and the green bars in Charts 5 and 6 shrink, repercussions will be felt in the red line. It is just a matter of when.
Thanks for reading!
