
The FOMC minutes for the October 27-28 meeting released the day before have been perceived by the markets as a definite signal that the Fed is ready to move in December. The FOMC meets on December 14-15.
Post-release of the minutes, the two-year Treasury yield shot back up to 0.9 percent. XLF, the SPDR Financials Sector ETF, rallied 1.8 percent. As did most stocks. If the Fed feels confident to begin to raise rates, the economy must be in good shape. That is the prevailing popular meme among investors.
But what exactly could be motivating the Fed to want to push up rates? Other than the fact that short rates have stayed near zero for seven years now.
If we assume that it is the economic data, then a better case for a hike could have been made early this year or late last year.
In November last year, 423,000 non-farm jobs were added, followed by 329,000 in December, with the entire 2014 averaging 260,000. Year-to-October, this has shifted down to an average of 206,000. Also last November, U.S. capacity utilization reached a cycle peak of 79.04 percent. Last month, this was 77.5 percent. In September last year, orders for non-defense capital goods ex-aircraft – proxy for business capital expenditures – jumped 11.9 percent year-over-year, to $74 billion. One year later, they shrank seven percent, to $68.8 billion.
The point is, if it was just the data, the Fed could/should have moved a lot earlier. This was particularly so given the gradual improvement in the jobs picture. The other half of its dual mandate – price stability – was subdued back then, and remains subdued now.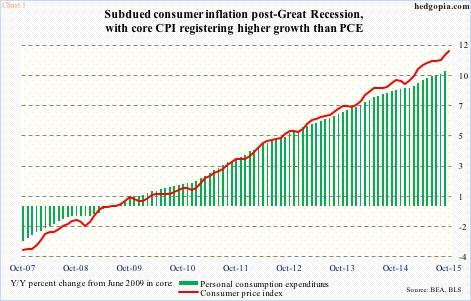
In September, core personal consumption expenditures – the Fed’s favorite measure of consumer inflation – rose 1.3 percent annually. The other important measure of consumer inflation – core consumer price index – is running a little hotter, rising 1.9 percent in October. The Fed has a two-percent goal. Despite all the stimulus money and three iterations of QE, inflation is a no-show throughout this recovery.
Chart 1 shows by how much core PCE and CPI have grown since Great Recession ended in June 2009, and shows muted growth at best. Of late, core CPI has been accelerating, but that is not the Fed’s focus.
This from the October 27-28 FOMC minutes:
“The staff projected that inflation would increase gradually over the next several years but would still be slightly below the Committee’s longer-run objective of 2 percent at the end of 2018. However, inflation was anticipated to reach 2 percent thereafter, with inflation expectations in the longer run assumed to be consistent with the Committee’s objective and slack in labor and product markets projected to have waned.”
Markets agree with this benign outlook. Five-year inflation expectations five years from now are languishing under two percent. The red line in Chart 2 has been trending lower since the early months of 2013, when QE3 was in full force.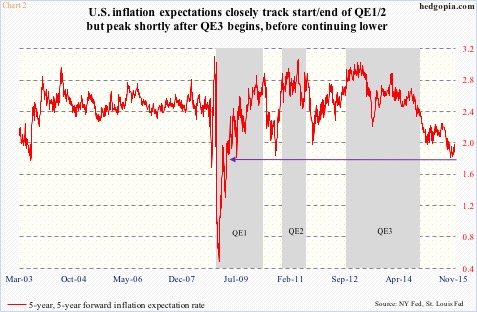
So why act now? There are two possibilities.
1. QE, as well as the zero interest-rate policy, have done wonders to stocks, and various other assets. This is a Fed that cherishes the wealth effect, but at the same time is probably aware of the negative effects of asset bubbles. The memories of 2000 and 2007 are all too fresh. Janet Yellen, Fed chair, last year talked about “substantially stretched” valuations in some parts of the market, especially for smaller social media companies and biotech stocks.
2. The Fed is trying to fill its monetary quiver with arrows – just in case. Preparing for the next downturn, so to speak.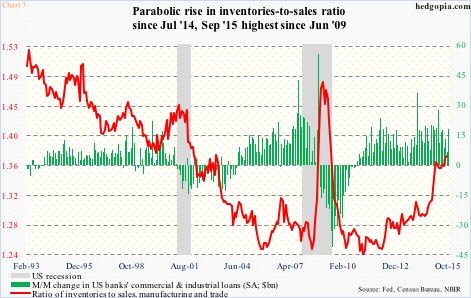
On this front, U.S. inventory is definitely not going the right direction. The inventories-to-sales ratio in manufacturing and trade in September reached 1.377 – the highest since June 2009. In other words, this is the highest it has ever been in the current recovery. The spike in the red line in Chart 3 particularly since July last year is noticeable. This was accompanied by persistent firmness in banks’ commercial & industrial loans.
To boot, corporate earnings have peaked. The trailing four-quarter rolling total of operating earnings of S&P 500 companies peaked in 3Q14 at $114.51, and were $104.15 four quarters later (Chart 4). As of last Thursday, 2015 estimates stood at $106.80, down from $137.50 at 2Q14. Estimates for 2016 have come down – $126.85 from $137.50 from as early as February this year. The trend is decelerating, and it needs to do a 360 in order for 2016 consensus to be met.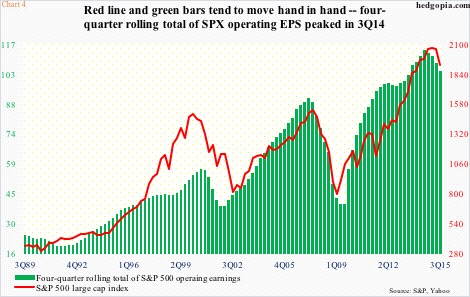
These estimates will be particularly at risk if the Fed’s goal is to indeed build a safety cushion. Market participants are not anticipating this. The conventional wisdom is bracing for a ‘one and done’ at best or a shallow hiking cycle at worst. Anything else can amount to a curve ball, and can reverberate through markets.
The December 15-16 meeting in this regard holds special importance – not because the Fed can make a move, but because this is a meeting in which we hopefully learn about the path going forward – provided there is a hike, that is.
Thanks for reading!
