
ITB, the iShares Home Construction ETF, has broken out. Support at $26 goes back to May 2013, and was defended several times during late April and early June. Since late April, ITB had also been trading within an ascending channel. It broke out of that channel as well as four-month horizontal resistance (Chart 1), and is now trading at an eight-year high.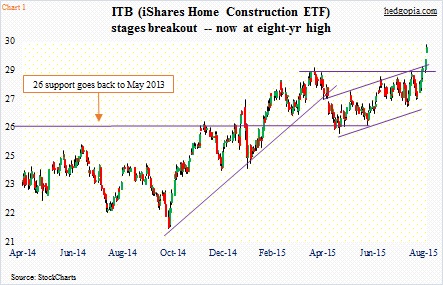
The catalyst for the breakout came on Monday as home builder sentiment jumped to nearly a 10-year high. The National Association of Home Builders’ housing market index came in at 61 in August, matching the reading in November 2005. The ETF further built on it yesterday on the back of July’s housing starts data plus Home Depot’s (HD) July-quarter results.
Directionally, ITB has a tendency to trade hand in hand with builder sentiment (Chart 2).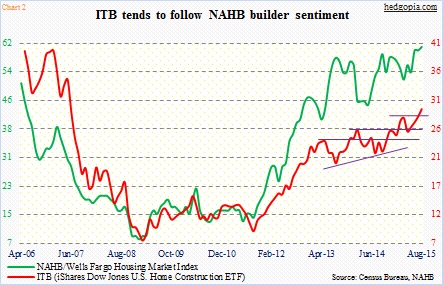
Builder sentiment in turn tends to follow U.S. housing starts. Between January 1985 and July 2015, the correlation between the NAHB housing market index and housing starts stood at 0.79. Once again, this is true directionally, but there are times sentiment tends to run ahead of itself.
Builder sentiment spiked in 1993, and then again in 1998, only to fall back down, as early optimism was not met (Chart 3); in due course, the red line dropped to meet with the green line. On the right side of that chart, there is a similar phenomenon unfolding currently. The green line is sprinting ahead, while the red line is content at jogging.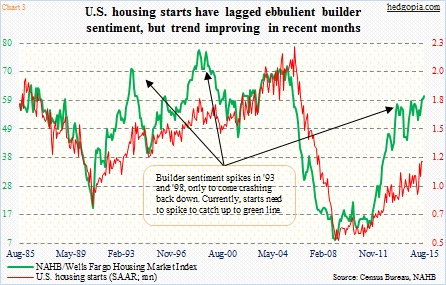
With that said, starts have been beginning to fare a lot better. In July, they came in at a seasonally adjusted annual rate of 1.2 million units, and have been above a one million-unit pace for four straight months. This series tends to be volatile month-to-month. On a 12-month rolling average basis, starts have been north of one million the last eight months, and in nine out of the last 10.
So are builders finally putting their money where their mouth is? Building permits were soft in July, down 16 percent month-over-month, but once again, the trend is up. On a 12-month rolling average basis, permits have been north of one million since March last year, and stood at 1.12 million in July – highest since June 2008.
What might be leading to this builder optimism?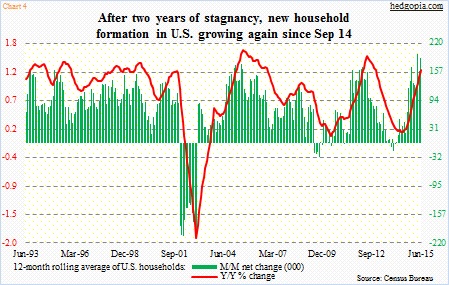
Household formation has been a bright spot recently. For nearly two years through August 2014, the number of U.S. households went sideways at 115 million, give and take. Then it began to rise September last year; June was 117.3 million. The ratio of households to population has gradually improved, to 0.365 from 0.36 in August last year. The improvement in recent months can be seen in Chart 4, which shows a 12-month rolling average. The trend has decidedly gotten better.
But before we pop the champagne and join the ITB bandwagon and indulge in high-fives, here is something to think over.
Mortgage rates are extraordinarily low, and they have been a big tailwind for sales. Wages and incomes are not. They are stagnant. Even the jobs market is losing a bit of a steam, although they remain decent. If there is one thing that can throw a serious monkey wrench into housing momentum is the rate at which home prices have been rising.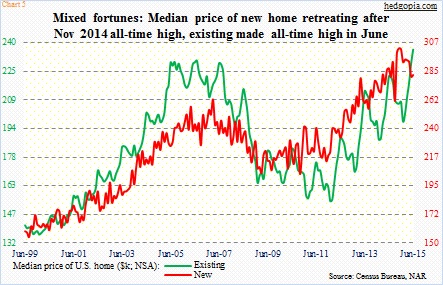
As Chart 5 shows, prices for both new and existing homes have now surpassed pre-bubble highs. To what extent they will begin to impact sales remains to be seen. We will get some indication tomorrow, as existing home sales for July will be reported. The June sales of 5.49 million units (SAAR) were the highest since February 2007, even as the median price jumped to an all-time high of $236,400. Pending home sales, which tend to lead sales of existing homes, were down 1.8 percent in June from May’s nine-year high. For further color, the price of a new home surged to $302,700 last November, before dropping to $281,800 by June. Sales reached 545,000 units (SAAR) in February, before decelerating to 482,000 units by June.
Speaking of price, ITB shows good price action. No doubt. More often than not, a breakout is followed by a retest – especially considering how overbought the ETF ($29.72) is, particularly on a daily chart. If the breakout is genuine, there will be bids waiting in the $28.30-$28.50 zone. Options would be one way to position for the imminent retest, but there is not enough premium in the weeklies. Worth waiting for retest.
Thanks for reading!
