
March sales of existing and new homes were a mixed bag, with the former up 5.1 percent month-over-month to a seasonally adjusted annual rate of 5.33 million units, and the latter down 1.5 percent m/m to 511,000 units.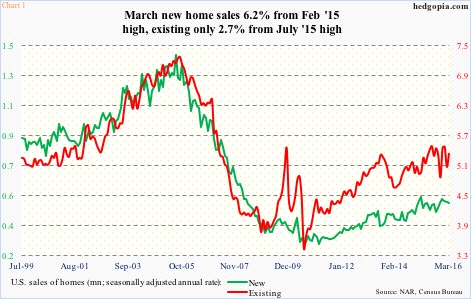
Post-bubble, sales of existing homes peaked at 5.48 million units in July 2015 – the highest since 5.79 million in February 2007 – and new homes at 545,000 units in February 2015 – the highest since 593,000 in February 2008 (Chart 1).
Monthly numbers obviously tend to be volatile. One way to get a read on a prevailing trend is by using a moving average.
Chart 2 uses a 12-month moving average of both existing and new home sales. In new homes, in three out of the last four months to March, sales came in at 503,000. In existing homes, January was 5.28 million, followed by 5.29 million in both February and March. Sales are flat-lining.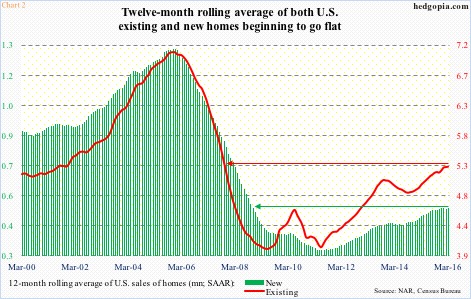
More importantly, most recent sales deceleration can be detected by using a shorter-term average. Using a three-month average, sales of existing homes peaked at 5.4 million last September, with March at 5.29 million, while new home sales peaked at 526,000 this February, with March at 517,000 (not shown here).
Deceleration in sales momentum is showing up even as home prices are holding up just fine. The median price of an existing home reached an all-time high of $236,300 last June, dropping to $222,700 by March. Similarly, the price of a new home peaked at $317,000 last November, declining to $288,000 by March. Versus post-bubble recovery in sales (Chart 1), home prices have had much sharper recoveries (Chart 3).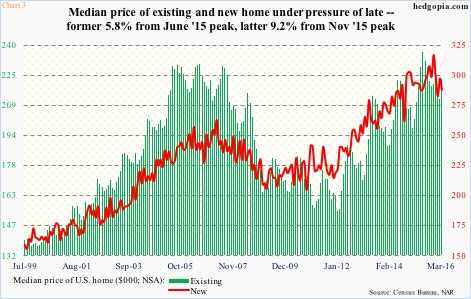
Price is an important variable in determining affordability, and, as things stand now, it is more of a negative.
With this as a background, the nine-week, 30-percent rally in ITB, the iShares Dow Jones home construction ETF, may come as a surprise. But not if we look at things through the eyes of technicals not just fundamentals.
ITB suffered a nine-week, 25.5-percent decline through the February 11th low. Momentum indicators, both daily and weekly, got pushed into deep oversold territory. By mid-January, short interest on ITB had risen to 14.7 million from 7.2 million at the end of September last year (not shown here).
As the rally began off of that February 11th low, short interest began to shrink. By the middle of April, it was more than cut in half, to 6.7 million. Through it all, the ETF rallied past both its 50- and 200-day moving averages, plus several other resistance levels.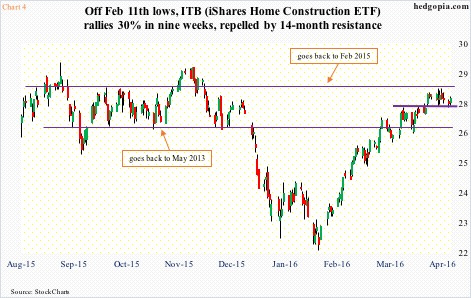
Things have now moved from one extreme to the other. ITB remains overbought on both daily and weekly basis. Last week produced a long-legged doji – potential sign of exhaustion.
The path of least resistance is down. Staying short ITB for now.
Thanks for reading!
