
U.S. sales of existing homes increased 0.7 percent month-over-month in November to a seasonally adjusted annual rate of 5.61 million units. This was the highest since 5.79 million in February 2007 (Chart 1). Sales had been flat for over a year until they broke out in October.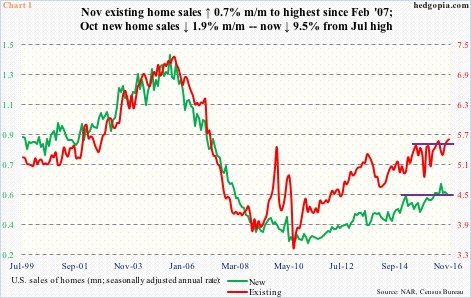
New home sales similarly broke out in April this year, further rising in July to a seasonally adjusted annual rate of 622,000 – the highest since 627,000 in January 2008. Sales since have weakened – struggling to save the breakout. October was down 1.9 percent m/m to 563,000. (November’s sales will be reported later this morning.)
From this perspective, it is too soon to say if the breakout in existing home sales is for real. Particularly so given the recent spurt in interest rates. Ten-year T-yields went from a historic low 1.34 percent on July 6 to 2.62 percent on December 15. Post-election alone, yields went up 80 basis points.
Mortgage rates accordingly have spiked, with the 30-year fixed mortgage rate up from 3.41 percent early July to 4.17 percent.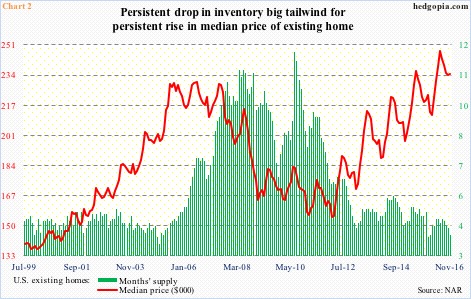
Then there is this.
Home prices continue to stay elevated. The median price of an existing home rose to a record $247,600 in June this year. November was $234,900 (Chart 2). Also in June, the median price of a new home was at a record $321,600 (not shown here); October was $304,500.
Price has galloped ahead – past bubble highs, even as sales are much weaker versus back then (Chart 1). Tight inventory is contributing to this discrepancy.
In November, inventory of existing homes stood at 1.85 million, and months’ supply dropped by 0.3 m/m to four, near the cycle low 3.9 in December last year (Chart 2). After the bubble burst, this peaked at 11.9 in July 2010.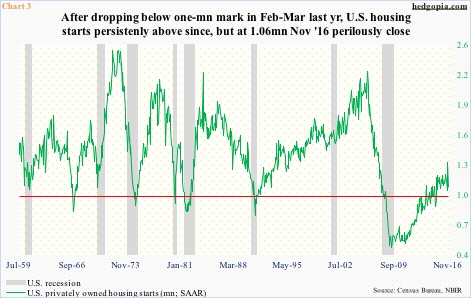
Rather curiously, despite this tight supply, housing starts continue to hover around the one-million mark. More often than not, starts below one million have tended to accompany a recession (Chart 3).
After the bubble burst, starts bottomed at a seasonally adjusted annual rate of 478,000 in April 2009 – a couple of months before the recession ended. Since April last year, starts have consistently remained above one million, with October this year at 1.34 million – the highest since 1.35 million in July 2007. That said, November fell back to 1.09 million. The red line in Chart 3 has been like a magnet in this cycle.
Hence the confusion reflected in ITB, the iShares U.S. home construction ETF ($27.87).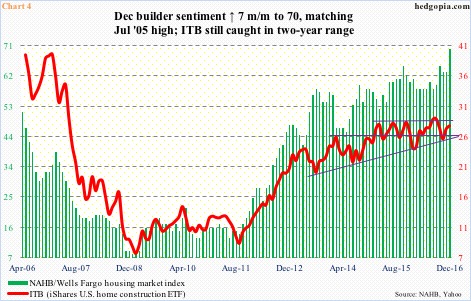
The ETF cannot break out. It has been rising along a rising trend line for over three years now (higher lows). At the same time, for two years now, it has been bobbing up and down in a rectangle – between $26 and $28, give and take.
U.S. builder sentiment shot up seven points in December to 70, matching July 2005 high, but that was not enough to push the ETF past resistance (Chart 4). Other signals coming from price, sales, and what have you, are too conflicting.
Until this changes – and there is no reason to believe it will at least in the near term – the trade continues to favor playing the range. Currently, it is at the top end.
Thanks for reading!
