
With 11 months gone, 2016 corporate bond issuance is up 0.8 percent year-over-year to $1.45 trillion. Of this, investment-grade is up 4.7 percent to $1.24 trillion, while high-yield shrunk 17.1 percent to $214.1 billion. This is based on the actual 11 months’ numbers.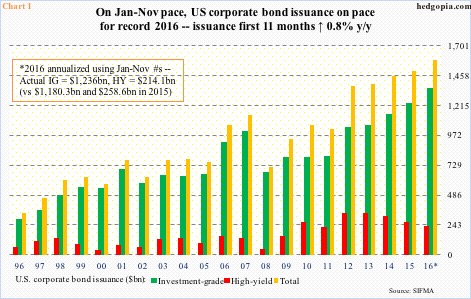
Annualizing January-November, however, 2016 is on pace to growing 5.9 percent to $1.58 trillion. For this to come through, corporations have to issue nearly $132 billion in December. A tall order, given that last year merely $53.7 billion was issued in December, with high-yield a paltry $3.1 billion. High-yield issuance has improved from the weak January-February this year; nonetheless is on course to contracting for the third consecutive year (Chart 1).
The bigger question is, if the rather subdued issuance in the first 11 months this year has had any impact on corporate buybacks.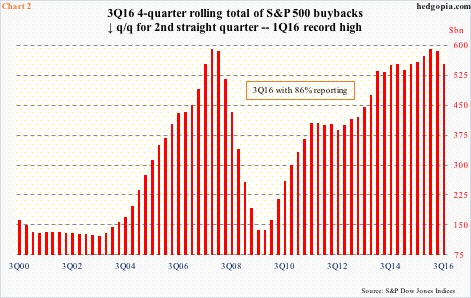
Buybacks by S&P 500 companies peaked at $161 billion in 1Q16, followed by $128 billion in 2Q16 and $117 billion in 3Q16 (the latter is preliminary, but is probably not off the mark directionally).
Incidentally, 1Q16 was the highest since $172 billion in 3Q07. On a four-quarter rolling total basis, buybacks reached a record $589 billion in 1Q16, followed by $585 billion in 2Q16 and $552 billion in 3Q16. Once again, it shows a decelerating trend, although it is lacking in intensity (Chart 2).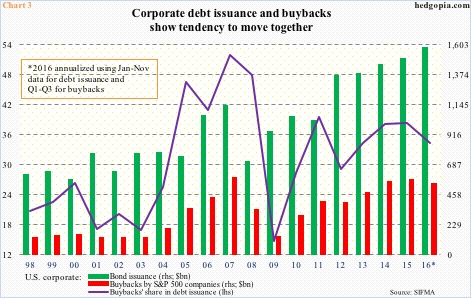
Corporate bond issuance and buybacks may not have one-to-one correlation, but as is seen in Chart 3, the two do show a tendency to move together.
In the chart, 2016 buybacks are annualized using the first nine months, and issuance using the first 11 months. What jumps out is the red bar that is smaller than last year’s. This, even as corporate bond issuance this year will probably at least equal last year’s. In 2015, total issuance was $1.49 trillion, so December needs $42.3 billion for a flat 2016. As noted above, December last year issued $53.7 billion.
More pertinent is what might next year bring.
First and foremost, non-financial corporate debt stood at $8.4 trillion in 2Q16, up from $6.5 trillion in 2Q09. So despite what we hear about corporate deleveraging, there has been none post-Great Recession. As Chart 1 shows, from 2009 through this year, north of $10 trillion has been issued.
The higher the leverage, the lesser the flexibility to issue new debt. This phenomenon may very well be unfolding in the corporate debt market. We will find out once December numbers are out. Lesser debt issuance cannot possibly be good news for buybacks.
There is one wildcard, though – president-elect Trump plans to allow U.S. corporations to repatriate profits held overseas at a low tax rate. Congress declared a tax holiday in 2005, and $359 billion was brought home, a good chunk of which was spent on dividends and buybacks.
Aside from that, odds are decent that the pace of buybacks continues to decelerate next year.
Thanks for reading!
