
In July’s Treasury International Capital System data released last Friday, there was one particular data point equity bulls were probably happy to see.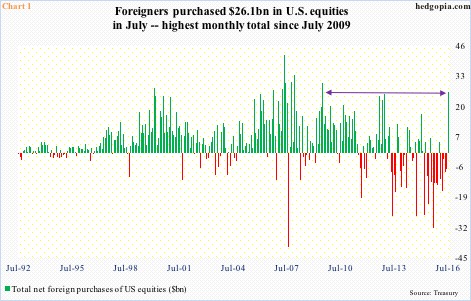
Global investors purchased $26.1 billion in U.S. equities in that month. This was the highest monthly purchase since July 2009 (Chart 1).
Too soon to say if July marks the beginning of a trend. It did come on the heels of five consecutive months of selling. Or if this was a one-off. In January this year, after five successive months of selling, foreigners bought $4.6 billion worth. But that turned out to be just one month. Beginning February, selling continued.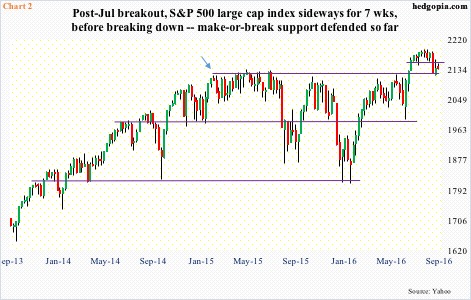
July also was a month in which the S&P 500 large cap index (2139.12) broke out of one-plus-year consolidation. The index hit 2120 in February last year, then started going sideways (arrow in Chart 2). In July this year, it rallied past 2134.72, which was the all-time high reached in May last year.
After that breakout, the S&P 500 rallied to 2193.81 by mid-August, before coming under slight pressure, but make-or-break support at 2120 has so far been defended.
It is possible the breakout has convinced foreigners to get back in … or at least sell less than they buy.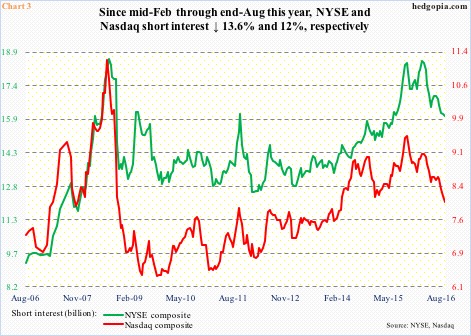
Alternatively, given the amount of selling they have done the past several years, it is possible foreigners were also short U.S. equities, which they covered post-breakout.
On the NYSE composite, short interest dropped from 16.8 billion at the end of June to 16.1 billion a month later. During the same period, Nasdaq composite short interest declined from 8.6 billion to 8.3 billion (Chart 3).
In fact, on both these indices, short interest has persistently declined since the middle of February – down 13.6 percent on the NYSE and 12 percent on the Nasdaq. Both these indices, along with several others, bottomed in early February this year, and through recent highs rallied 18.1 percent and 25.6 percent, in that order.
What else could have led these foreigners to switch bias from bearish to bullish? Definitely not economic data, which has been sluggish for a while, and July was no exception. And definitely not earnings. At the end of July, operating earnings estimates of S&P 500 companies for 2016 were $112.85, down from $131.99 a year ago (courtesy of S&P Dow Jones Indices). (They have since dropped to $110.28.)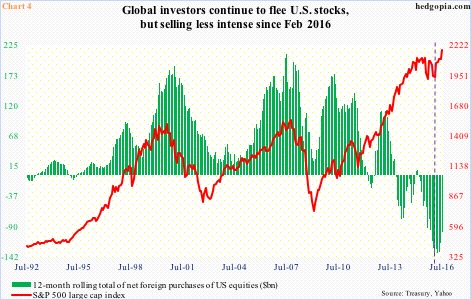
We just have to wait and see until August numbers come out to find out if July was indeed a one-off or led by short-covering or genuine buying. If it is the latter, this potentially reverses a trend that has been in place since the middle of 2013.
Historically, foreign purchases of U.S. equities and the S&P 500 have tended to move in tandem. In Chart 4, the green bars represent a 12-month rolling total of these purchases, which started to diverge from the red line three years ago. Incidentally, in February this year, purchases totaled minus $138.9 billion – an all-time high – and started to decline. As a reminder, stocks bottomed in February.
On a net basis, foreigners have been avoiding U.S. stocks, but since the February peak, the green bars in Chart 3 have been shrinking. From this perspective, at least directionally, they are now moving hand in hand with the S&P 500 (denoted by the dashed lines in the chart). But the real change in trend will have taken place when foreigners will have begun to purchase on a net basis, which would be quite a development particularly at a time when U.S.-based equity funds continue to experience outflows. Since the February 10th week this year, $90 billion has been redeemed (courtesy of ETF.com).
Thanks for reading!
