
July turned out to be an important month for the S&P 500 large cap index. More than a year after it peaked in May last year, the index reached a new high, rising 3.6 percent for the month.
The July 11th breakout has potential to be an important one. Using a measured-move method, technicians can come up with a target of 2280.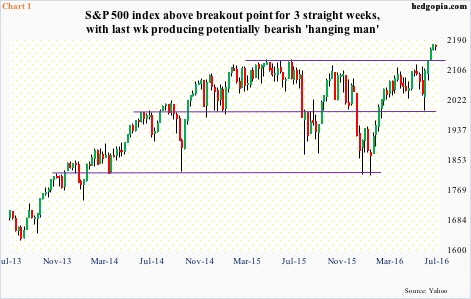
Bears can rightly point to non-confirmation – from underperforming transports and small-caps to persistently dropping Treasury yields to anemic volume, among others. But right here and now price is the ultimate arbiter.
Having rallied nine-plus percent since the June 27th post-Brexit low (and north of 20 percent since the February 11th low), the S&P 500 remains grossly overbought, particularly on a daily and now weekly basis. Last week produced a hanging man candle (Chart 1), which tends to warn of a potential trend reversal, but needs confirmation. Should the index begin to come under pressure, breakout retest will have huge significance.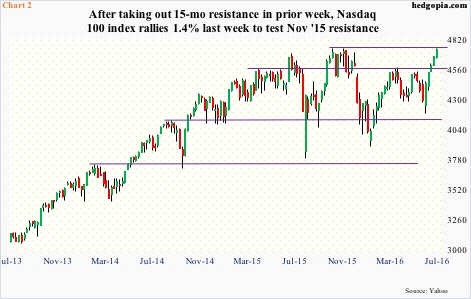
Bulls in the meantime can take heart from the fact that techs, which until recently had been lagging like transports and small-caps, have come alive. The Nasdaq 100 index jumped 7.1 percent in July, and is itching to break out of one-year resistance (Chart 2). In fact, on a closing basis, it did just that, breaking out to a new high, although on an intra-day basis is yet to surpass the March 2000 all-time high of 4816.35 (1.8 percent away).
Techs’ better-than-peer performance came in a week in which results from heavyweights like Apple (AAPL), Facebook (FB), Alphabet (GOOGL), and Amazon (AMZN) were received well.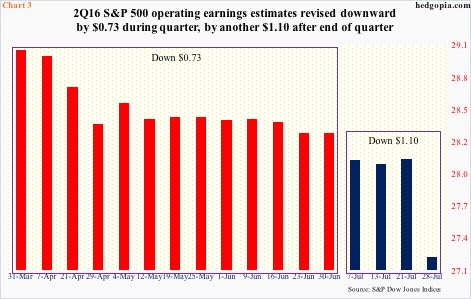
As of last Thursday, 317 of S&P 500 companies have reported 2Q16 results, with 222 beating on operating earnings estimates, 62 missing, and 33 meeting. On a reported basis, only 122 beat, and on sales 171.
A 70-percent beat ratio on an operating basis is not too shabby. But here is the rub. It is not a clean beat, if it can be labeled that way.
Back in 4Q14, 2016 operating earnings estimates were $137.50, now revised downward to $112.85. Last week alone, 2016 estimates were reduced by $0.85. Similarly, 2Q16 estimates last week were reduced by $0.87 to $27.22; when the quarter ended, these companies were expected to earn $28.32 (Chart 3). In other words, the 2Q16 bar has been lowered by $1.10 in just the past four weeks … in the midst of earnings season. In that respect, the beat ratio should probably have been higher.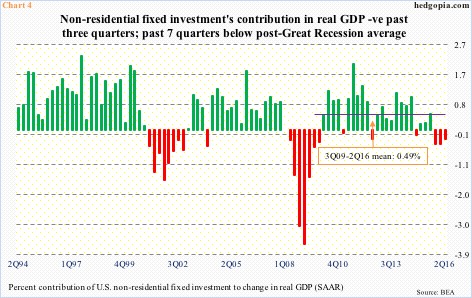
Ironically, techs’ outperformance last week came in a week in which the first estimate of 2Q16 GDP was published, and yet again, it was a disappointment. Real GDP grew at a much-lower-than-expected 1.2 percent, coming on the heels of growth of 0.9 percent in 4Q15 and 0.8 percent in 1Q16. The sub-par growth continues. Post-Great Recession, growth has averaged a mere 2.1 percent, versus a long-term average (going back to 2Q47) of 3.2 percent.
Capital expenditures are faring worse. In the last three quarters, non-residential fixed investment subtracted from real GDP growth. In 2Q16, investment totaled $2.17 trillion (seasonally adjusted annual rate), down from $2.22 trillion in 3Q15. Real GDP during the period grew to $16.58 trillion from $16.45 trillion. One look at Chart 4, and it is easy to see how suppressed activity has been in fixed investment.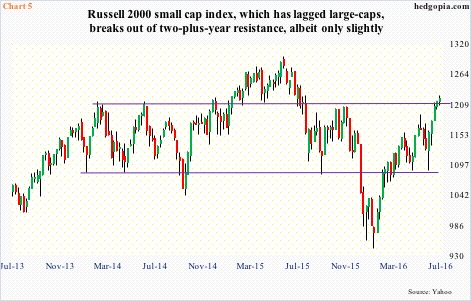
Tech outfits live and die by capex. It is uncharacteristic of them to rally as strongly as they have (nearly 22 percent in nearly six months) in the midst of shrinking fixed investment.
Is the Russell 2000 small cap index next then? Makes you wonder.
First, it was the S&P 500 to break out. Depending on one’s perspective, the Nasdaq 100 either has already followed suit or on the verge of one. The Russell 2000 is a ways off from scoring a new all-time high, but has meekly broken out of March 2014 resistance (Chart 5). Can it build on it?
Small-caps inherently tend to be oriented toward the domestic economy, which continues to struggle to put up good numbers. Viewed this way, it makes sense that the Russell 2000 is lagging their large-cap brethren. At the same time, this probably also means that the Fed is likely to maintain the status quo in interest rates, which could potentially help improve sentiment toward small-caps. Maybe.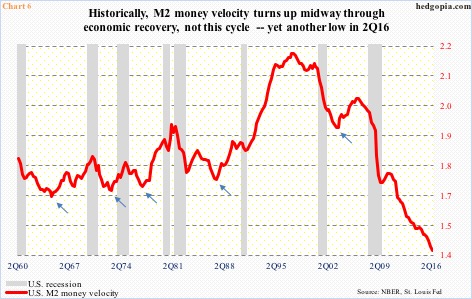
The Fed is in a bind. Its conventional monetary quiver has run out of arrows, and it has missed an opportunity to push up rates when data were coming in stronger. Data points like Chart 6 do not help much.
Money velocity continues to disappoint. Traditionally, it has tended to turn up midway through the cycle (arrows in Chart 6). Not so this time around. The U.S. economy has been in recovery mode for over seven years, with several metrics such as capacity utilization already peaking. But velocity keeps making new lows. There is not much fundamental tailwind for stocks, come to think of it.
Stocks are not trading on fundamentals anyway – for a while now. Using trailing 12-month numbers for S&P 500 companies, 2Q16 boasts a price-to-sales ratio of 1.85, the highest ever, and an operating price-to-earnings ratio of 21.1x, the highest since 3Q09. In an odd manner, this helps boost bears’ conviction, resulting, for instance, in high short interest, which the bulls have made good use of in squeezing the shorts.
This is also evident in the futures market.
In the week ended February 9th this year (the S&P 500 bottomed on the 11th), non-commercials were net short 234,321 contracts in e-mini S&P 500 futures, before getting squeezed. The index is up north of 20 percent since, and net shorts have been replaced with net longs. There is a similar phenomenon on the Nasdaq 100, with non-commercials first getting squeezed and now heavily net long.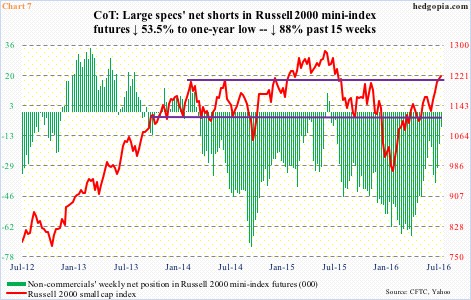
Enter Russell 2000 mini-index futures. In the week ended April 12th this year, net shorts were 66,871 contracts, which by last Tuesday have been reduced to 8,190 (Chart 7). This persistent decrease in net shorts was a natural tailwind for the Russell 2000. Now, if the index follows the pattern seen in the S&P 500 as well as the Nasdaq 100 – net shorts gradually making way for net longs – the Russell 2000 has a chance to build on last week’s tentative breakout, although sustainability is a big question mark.
Thanks for reading!
