Here is a brief review of period-over-period change in short interest in the January 17-31 period in the Nasdaq and NYSE Group as well as nine S&P 500 sectors.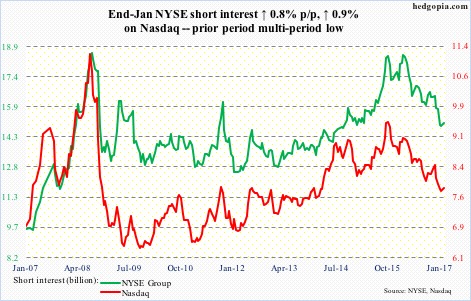
Nasdaq – short interest ↑ 0.9% p/p; Nasdaq composite ↑ 0.7%
During the January 17-31 period, bulls defended the rising 10-day moving average all along. Tech came to life as soon as 2017 began, with shorts lending a helping hand. Leading up to the period, short interest dropped from 8.4 billion mid-November last year to 7.8 billion mid-January.
NYSE Group – short interest ↑ 0.8% p/p; NYSE composite ↓ 0.04%
Support at 11100 was tested several times during the reporting period. Bulls had difficulty saving the January 25 break out of 11250 resistance. This probably emboldened the shorts. That resistance was taken out this week.
As regards to both the NYSE and Nasdaq, shorts could not have been more helpful. Since the lows in stocks in February last year, short interest has persistently come under pressure. This probably continued this week as major indices once again rallied to new/near all-time highs.
…
Of the nine S&P 500 sectors below, short interest fell p/p in XLE, XLP and XLU and rose in XLB, XLF, XLI, XLK, XLV and XLY. During the period, XLE closed under the 50-day moving average, the rest closed above.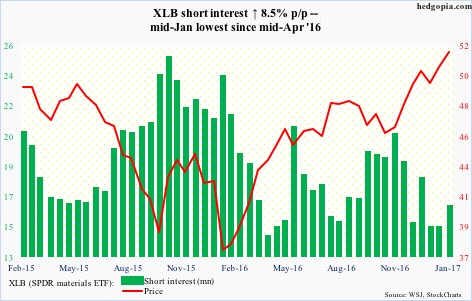
XLB (SPDR materials ETF) – short interest ↑ 8.5% p/p, ETF ↑ 2.1%
Most recently, XLB short interest began to drop from mid-November, which is about when the ETF began to rally. On January 26, it broke out of six-week congestion to a new all-time high of $53.26, before coming under slight pressure.
There is major support at $50. Before this lies support at $51.30, which was tested this Wednesday. A break of this potentially emboldens the bears.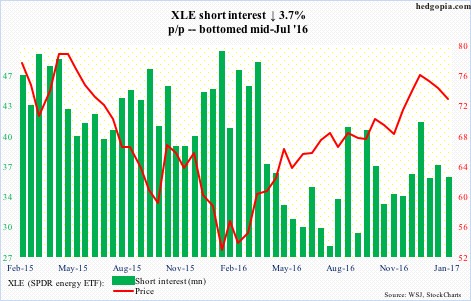
XLE (SPDR energy ETF) – short interest ↓ 3.7% p/p, ETF ↓ 2%
XLE peaked on December 12 at $78.04, and then traded within a declining channel. During the reporting period, it lost the 50-day moving average – now flattish. On the weekly chart, there is room for continued unwinding of overbought conditions, with several indicators reaching the median – a potential spot for the bulls to put their foot down. Should they succeed, short-covering could potentially help them.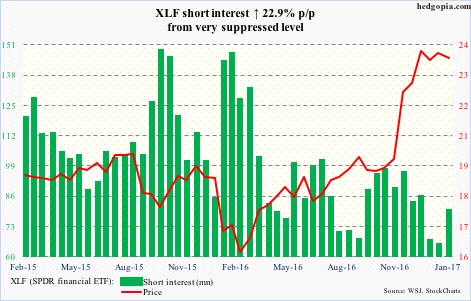
XLF (SPDR financial ETF) – short interest ↑ 22.9% p/p, ETF ↓ 0.9%
The range-bound action from early December continued, with XLF tagging $23.80 on January 26. Leading up to the reporting period, shorts acted as if they expected a breakout, with short interest persistently dropping from mid-November last year. This time around, they added, which can come back to haunt them, as the ETF keeps hammering on that resistance.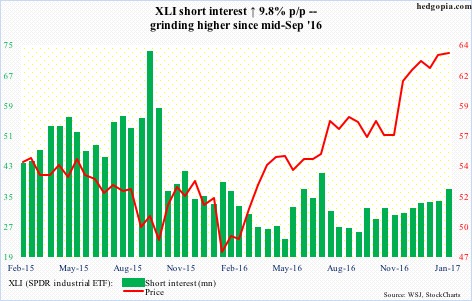
XLI (SPDR industrial ETF) – short interest ↑ 9.8% p/p, ETF ↑ 0.3%
XLI broke out of six-week consolidation to an all-time high of $64.85 on January 26, followed by slight downward pressure. In July last year, the ETF broke out of a months-long $46-$55.50 range, giving technicians a target of $65. The measured-move target has been met. Short interest has been gradually building since last November.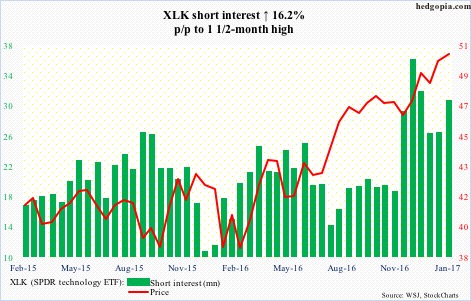
XLK (SPDR technology ETF) – short interest ↑ 16.2% p/p, ETF ↑ 0.8%
Post-Nov 8 U.S. presidential election, XLK lagged, and shorts got very aggressive. Come 2017, the ETF did a U-turn. Shorts covered some, but short interest remains sizable. XLK rallied to yet another high on Thursday. Elevated short interest must be coming in handy.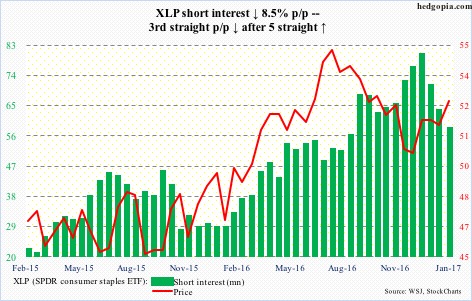
XLP (SPDR consumer stables ETF) – short interest ↓ 8.5% p/p, ETF ↑ 2.1%
XLP peaked on July 14 last year, even as shorts began to get aggressive. The ETF bottomed on December 1, and the elevated short interest helped. The ETF closed above the 200-day moving average during the period. Resistance at $52 was taken out. Short interest dropped 28 percent in the last month and a half.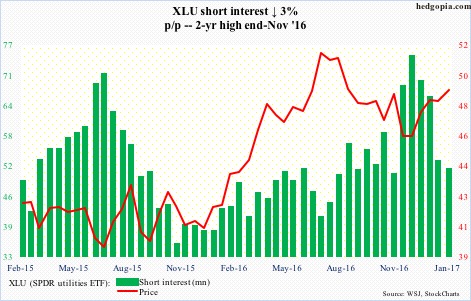
XLU (SPDR utilities ETF) – short interest ↓ 3% p/p, ETF ↑ 1.4%
During the January 1-13 period, shorts cut back 20 percent. Their intuition proved right. During the January 17-31 period, not only did XLU closed above the 200-day moving average but also took out resistance at $49. The 50-day continues to rise.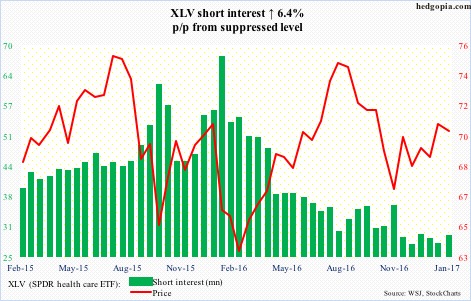
XLV (SPDR healthcare ETF) – short interest ↑ 6.4% p/p, ETF ↓ 0.6%
Bulls defended a rising trend line from early November. It remains to be seen if they can take out resistance at just under $72, which goes back to June 2015 – and which was tagged twice this week. Even if it is conquered, there is not much room for squeeze as short interest remains suppressed.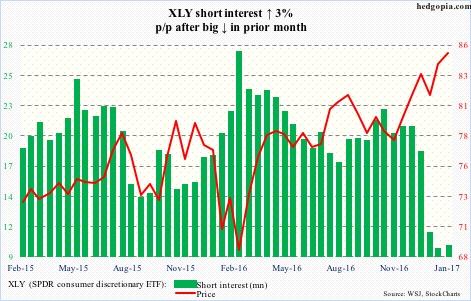
XLY (SPDR consumer discretionary ETF) – short interest ↑ 3% p/p, ETF ↑ 1%
XLY rallied to an all-time high of $85.64 on January 26. This was preceded by a 54-percent drop in short interest in a month and a half. During the January 17-31 period, short interest rose but only some.
Thanks for reading!

