
Here is a brief review of change in short interest in the October 1-14 period in the Nasdaq and NYSE Group as well as nine S&P 500 sectors.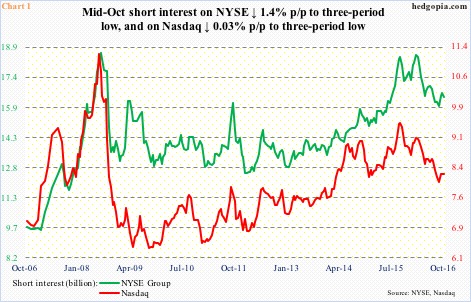
Nasdaq – short interest ↓ 0.03 percent p/p; Nasdaq composite ↓ 1.8 percent
During the reporting period, the index lost 5275 near-term support on October 11, then losing the 50-day moving average. This did not embolden the shorts to add to short interest. The average was later recaptured in the current period.
Versus other major U.S. indices, tech-heavy Nasdaq is on fire. Within tech, large-caps are leading. Apple (AAPL), Alphabet (GOOGL), Microsoft (MSFT), Amazon (AMZN) and Facebook (FB) comprise the five largest companies today.
On Tuesday, the Nasdaq 100 rose to yet another high, not the Nasdaq composite. The afore-mentioned five are doing all the heavy-lifting. They are all way extended.
NYSE Group – short interest ↓ 1.4 percent p/p; NYSE composite ↓ 1.9 percent
The NYSE composite peaked in May last year, as did the S&P 500 large cap index. The latter has gone on to surpass that high, but not the former. Early September, the NYSE made a lower high. The 50-day moving average is now decidedly dropping. In fact, in three sessions through September 30, that average was tested – unsuccessfully – and the index stayed under that average throughout the reporting period. Still is.
This should have emboldened the shorts, but they decided to reduce exposure a tad – probably did not want to take risk going into earnings. That said, in the month prior to the Oct 1-14 period, short interest had gone up four percent. The NYSE dropped 1.4 percent during the period.
Thus far in October, the NYSE is down 1.6 percent. This preceded a spinning top in September, and a doji in August – signs of fatigue.
Of the nine S&P 500 sectors below, short interest rose in seven p/p. Four are above their respective 50-day moving average (XLE, XLF, XLK, and XLY) and five below (XLB, XLI, XLP, XLU, and XLV).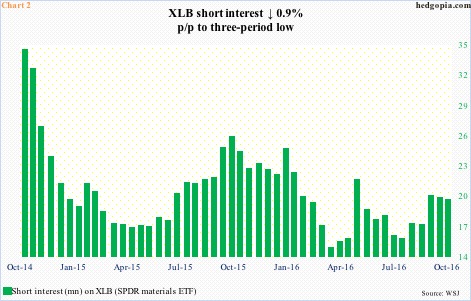
XLB (SPDR materials ETF) – short interest ↓ 0.9 percent p/p, ETF ↓ 3.0 percent
XLB has been under the 50-day moving average since September 9. The October 13th drop to $45.56 came close to re-testing the April 2016 breakout at $45-plus. Shorts are likely to get aggressive once this support gives way. Short interest has slightly gone down in the past month.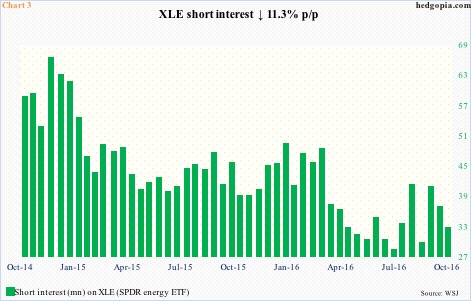
XLE (SPDR energy ETF) – short interest ↓ 11.3 percent p/p, ETF ↓ 1.1 percent
XLE managed to push to $71.98 before coming under pressure. Fatigue is setting in. Among S&P 500 sectors, the ETF is up the most this year. Shorts got squeezed big time as XLE bottomed in January this year, hence are hesitating to rebuild position.
Exxon (XOM) and Chevron (CVX) report 3Q16 this Friday AM.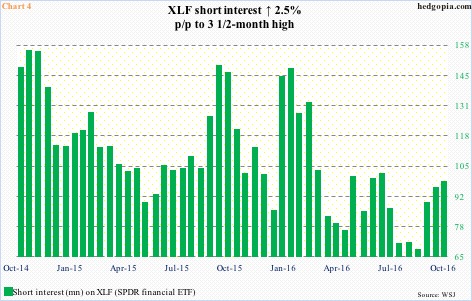
XLF (SPDR financial ETF) – short interest ↑ 2.5 percent p/p, ETF ↑ 0.6 percent
XLF rallied back above the 50-day moving average, but only to close right on it. On the last day of the reporting period, JP Morgan (JPM), Wells Fargo (WFC), PNC Financial (PNC), and Citibank (C) reported 3Q16; early strength was sold in that session. But those jitters did not last very long. These stocks, and others, have gone on to shake the jitters off. Financials are currently taking the cue from the short end of the yield curve, which expects a hike in December (13-14). Shorts have been adding since the end of August.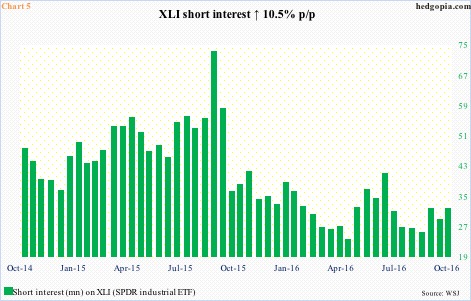
XLI (SPDR industrial ETF) – short interest ↑ 10.5 percent p/p, ETF ↓ 2.0 percent
XLI lost the 50-day moving average, but not support at $56.50. A break of this support would probably embolden shorts but that did not happen. Short interest remains suppressed.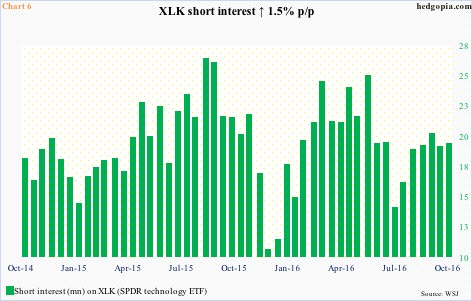
XLK (SPDR technology ETF) – short interest ↑ 1.5 percent p/p, ETF ↓ 0.9 percent
The $47.20 support was briefly lost. As well, on October 13 XLK dipped below the 50-day moving average intra-day before closing above it. Subsequently, in the current period, it found support at that average.
Short interest has been going up since mid-July. The ETF has rallied since, but shorts are hanging on. Either this conviction pays off big, or will be a source of squeeze. On a weekly chart, XLK is on the verge of a bearish MACD crossover.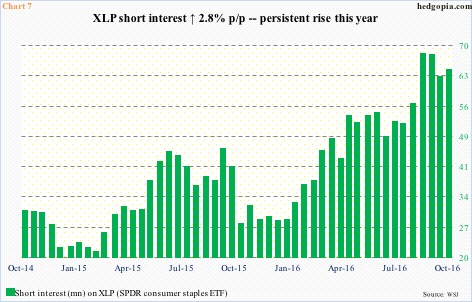
XLP (SPDR consumer stables ETF) – short interest ↑ 2.8 percent p/p, ETF ↓ 1.6 percent
Short interest began to rise since the beginning of the year. Shorts, although hurt by a relentless rally until the ETF peaked in July this year, have finally been vindicated. During the period, it briefly closed under the 200-day moving average before managing to close just above. XLP just suffered a monthly bearish MACD crossover.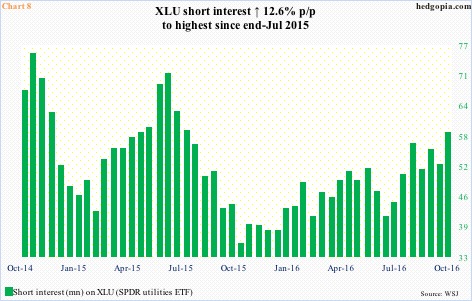
XLU (SPDR utilities ETF) – short interest ↑ 12.6 percent p/p, ETF ↓ 2.5 percent
Not only did XLU stay under the 50-day moving average throughout the period but it also closed under the 200-day moving average. That said, the January 2015 high of $46.85 was defended, off of which the ETF rallied toward (and past in the current period) the 200-day.
Short interest has gone up since mid-July. Odds of a short squeeze are rising. XLU is itching to rally.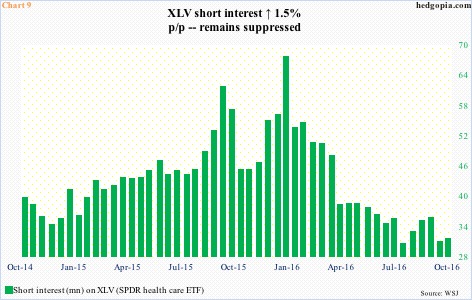
XLV (SPDR healthcare ETF) – short interest ↑ 1.5 percent p/p, ETF ↓ 3.5 percent
After XLV was repelled at its 50-day moving average on September 22, it has been under pressure. The ETF went on to close under the 200-day moving average during the October 1-14 period. Short interest remains suppressed – lessening odds of a squeeze-fueled rally.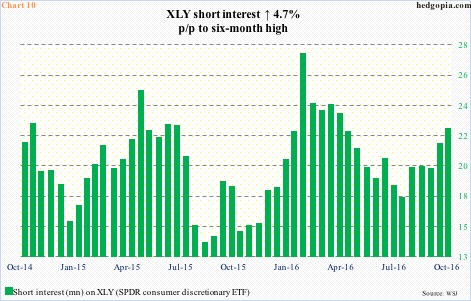
XLY (SPDR consumer discretionary ETF) – short interest ↑ 4.7 percent p/p, ETF ↓ 1.4 percent
XLY stayed under the 50-day moving average throughout. This was retaken this Monday, but only to lose in the very next session. The ETF just had a bullish daily MACD crossover, but is struggling to build on it. Short interest has risen since the middle of August.
Thanks for reading!
