
Here is a brief review of change in short interest in the October 17-31 period in the Nasdaq and NYSE Group as well as nine S&P 500 sectors.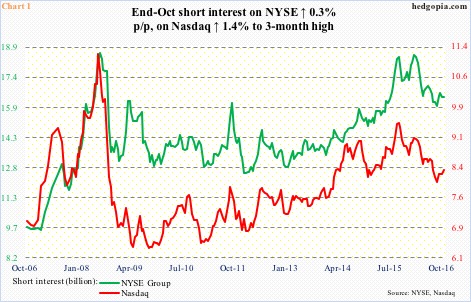
Nasdaq – short interest ↑ 1.4 percent p/p; Nasdaq composite ↓ 0.5 percent
During the reporting period, the index retook the 50-day moving average but only to quickly lose it. The October 24th high of 5311.50 came on the heels of 5340.52 on October 10 and the all-time high of 5342.88 on September 22 – in other words, lower highs.
This marked a divergence in that the Nasdaq 100 rose to an all-time high of 4911.76 on October 25. This is a case of the generals leading and the foot soldiers lagging – not necessarily good in a larger scheme of things.
Monthly momentum indicators on both the Nasdaq composite and Nasdaq 100 are beginning to turn lower, probably emboldening shorts to get aggressive. Short interest remains elevated.
NYSE Group – short interest ↑ 0.3 percent p/p; NYSE composite ↓ 0.4 percent
Unlike the Nasdaq composite, the NYSE composite peaked a long time ago, in May last year. Incidentally, the S&P 500 large cap index peaked in that month as well, but it went on to surpass that high. Not the NYSE. In the September 31-October 14 period, it also lost a rising trend line from February this year.
In October, the NYSE dropped 2.2 percent. This preceded a spinning top in September, and a doji in August – signs of fatigue. Monthly indicators have turned lower.
Shorts are staying put. The mid-February (2016) level of 18.5 billion shares was essentially on par with the all-time high of 18.6 billion at the end of July 2008. From the mid-February high, short interest gradually came down as stocks rallied off of the February lows, but it remains elevated.
Of the nine S&P 500 sectors below, short interest rose in four p/p (XLB, XLE, XLP, XLV). During the period, three were above their respective 50-day moving average (XLF, XLK, XLU) and six below (XLB, XLE, XLI, XLP, XLV, XLY).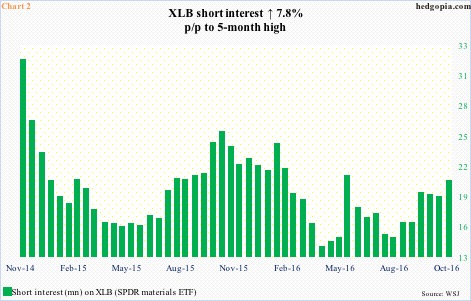
XLB (SPDR materials ETF) – short interest ↑ 7.8 percent p/p, ETF ↑ 0.9 percent
The $45-plus support was successfully tested in the September 31-October 14 period – on October 13, to be exact. This should have discouraged shorts from getting aggressive. And it did. Short interest went down 0.9 percent in that period. But in the October 17-31 period, they went ahead and increased short interest to a five-month high.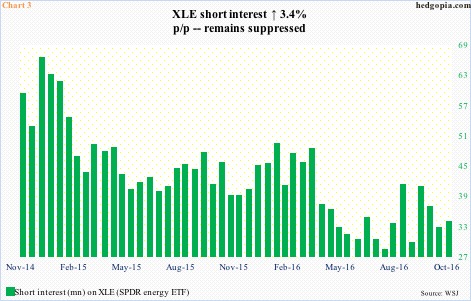
XLE (SPDR energy ETF) – short interest ↑ 3.4 percent p/p, ETF ↓ 1.7 percent
The ETF peaked at $71.98 in the prior period – on October 10 – and continued lower in the October 17-31 period, losing the 50-day moving average on October 31. Shorts got squeezed big time as XLE bottomed in January this year, hence are hesitating to aggressively rebuild position.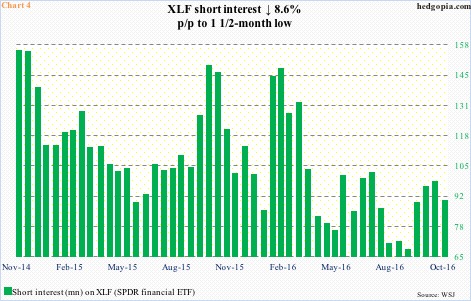
XLF (SPDR financial ETF) – short interest ↓ 8.6 percent p/p, ETF ↑ 1.7 percent
Financials continued to take the cue from the short end of the yield curve, which expects a hike in December (13-14). With the 50-day moving average slightly trending higher, shorts have been cautiously adding since the end of August.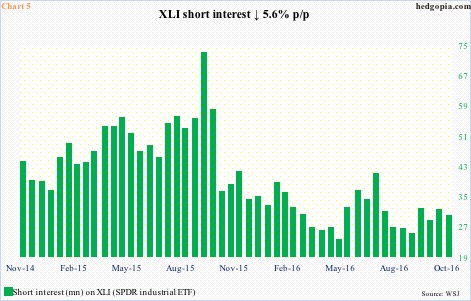
XLI (SPDR industrial ETF) – short interest ↓ 5.6 percent p/p, ETF ↓ 0.03 percent
Support at $56.50 was tested again – successfully. Short interest was as high as 72.7 million in the middle of September last year. These shorts got squeezed big time. Once bitten, twice shy. Short interest remains suppressed.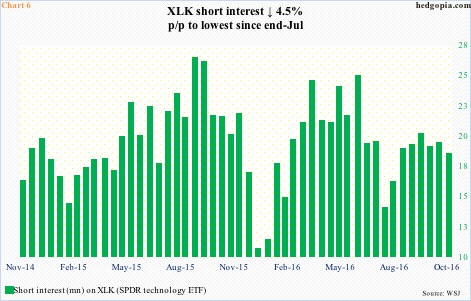
XLK (SPDR technology ETF) – short interest ↓ 4.5 percent p/p, ETF ↑ 0.1 percent
The $47.20 level was successfully tested on October 20 … the level at the time also approximated the 50-day moving average, which was once again tested on October 28. The average is constantly being pounded from above. Short interest fell in the October 17-31 period, but has gone up since mid-July.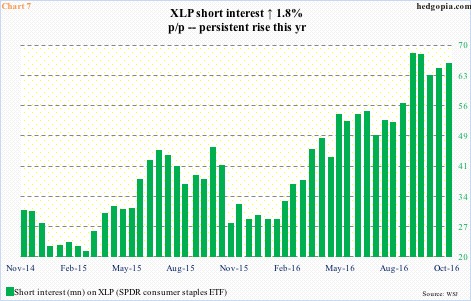
XLP (SPDR consumer stables ETF) – short interest ↑ 1.8 percent p/p, ETF ↑ 0.8 percent
The ETF continued to hover around its 200-day moving average, with the 50-day moving average above in sharp decline. It has been under pressure since July. The rather elevated short interest can potentially result in squeeze should the bulls manage to put their foot down.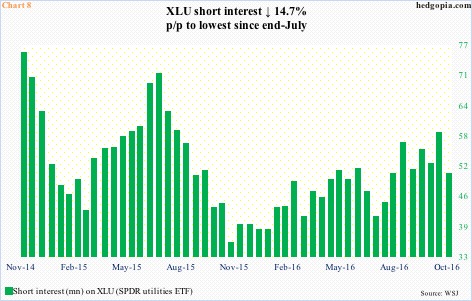
XLU (SPDR utilities ETF) – short interest ↓ 14.7 percent p/p, ETF ↑ 3.5 percent
The ETF pretty much revolved around the 200-day moving average, except on October 31 when it rallied two percent, past its 50-day moving average. This may have caused shorts to cover.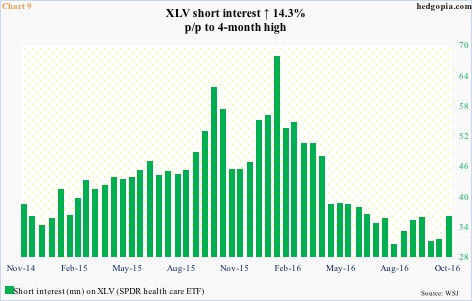
XLV (SPDR healthcare ETF) – short interest ↑ 14.3 percent p/p, ETF ↓ 3.3 percent
It rallied past the 200-day moving average, but stayed above it for just three sessions. After XLV was repelled at its 50-day moving average on September 22, it has been under pressure. Short interest remains suppressed, even though it rose in the October 17-31 period.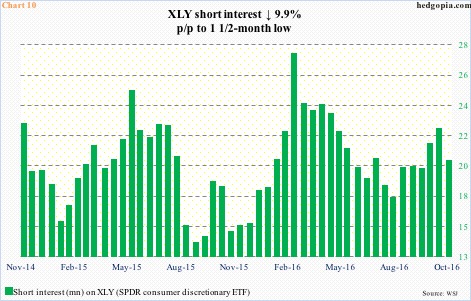
XLY (SPDR consumer discretionary ETF) – short interest ↓ 9.9 percent p/p, ETF ↓ 1.0 percent
Rallied past the 50-day moving average, but stayed above it just for one session. The subsequent decline found support at the 200-day moving average toward October-end. Shorts would probably get aggressive if this average was lost. They rather cut back.
Thanks for reading!
