
U.S. capex continues to let down.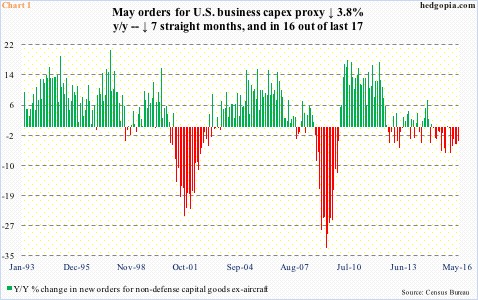
May’s revised figures for new orders for non-defense capital goods ex-aircraft – proxy for business capital expenditures – were published on Tuesday, and there was not much change in the trend.
Orders fell 0.5 percent month-over-month to a seasonally adjusted annual rate of $62.3 billion. This was the second consecutive m/m drop. Orders fell 3.8 percent year-over-year, for a seventh straight y/y drop; in the last 17 months, orders have dropped in 16 (Chart 1). If there is any momentum, it is to the downside. Orders peaked way back in September 2014, at $70.1 billion.
Unless orders quickly snap out of the current funk, odds are they will continue to post y/y decline for several more months. In 2015, orders were in the $65 to $66 billion range for at least six months through November before coming under pressure.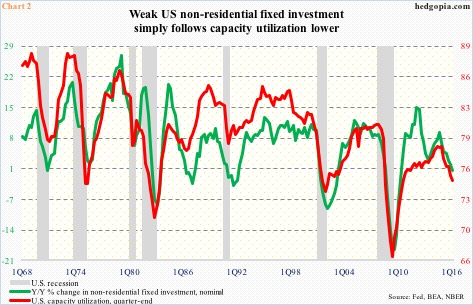
In a larger scheme of things, business capex simply follows capacity utilization. In May, less than 75 percent of the nation’s capacity was in use. (June numbers will be out next Friday.) Utilization fell 2.2 percent y/y in May to 74.9 percent. This was the 15th straight y/y drop.
In the current business cycle, capacity utilization began to come under pressure before even crossing 80 percent. It peaked in November 2014 at 78.9 percent (Chart 2). With this kind of utilization of the existing capacity, there is no need for businesses to get aggressive. And they have not.
In 1Q16, nominal non-residential fixed investment inched up 0.2 percent y/y to a seasonally adjusted annual rate of $2.28 trillion. This was the slowest growth recorded since negative reading in 1Q10.
Odds of things changing for the better anytime soon? Not a whole lot.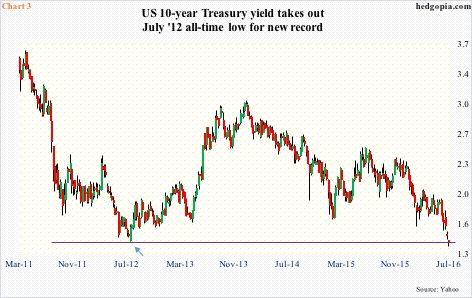
For businesses to even think of adding to capacity, they have to first begin to deplete the existing one. For that to occur, the economy – both here and globally – needs to pick up steam. The prevailing trend is anything but. From the IMF to the World Bank to the OECD, they have all taken out the knife, cutting down growth forecasts… all year long. Ditto with consensus forecasts for U.S. growth this year, which currently stands at two percent. The economy grew 2.4 percent last year.
This was before Brexit hit. Too soon to say if this is a development influential enough to negatively impact global growth this year, or next. But bond vigilantes are acting as if Brexit is a concern.
Between June 23rd and 27th, 10-year Treasury yields dropped from 1.74 percent to 1.46 percent. The S&P 500 was pounded for a 5.3-percent decline in those two sessions, followed by a 5.1-percent jump in the next four. The 10-year yield, however, went flat during those four sessions. The bond market apparently was not buying the optimism shown by the stock market. Yesterday, yields dropped to an all-time low of 1.34 percent before closing the session at 1.39 percent (Chart 3).
We can quibble over what might be causing this rush toward sovereign debt. But one thing is for sure. If economic growth was strong, or getting stronger, the yield curve would probably shift up. Exports would be stronger. The number of people leaving the labor force would be smaller. Incomes would be healthier, wages stronger. And inflation would probably be firmer. Going by government statistics, the latter is a no-show… this, despite trillions of dollars of quantitative easing (QE) stimulus from the Fed. Nor do markets expect any in the foreseeable future.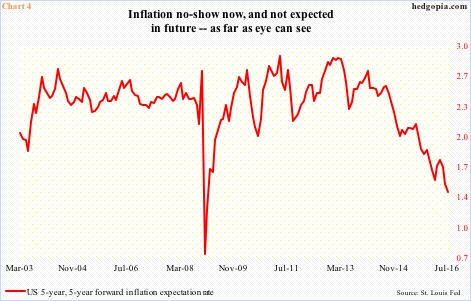
The five-year, five-year forward inflation expectation rate stands at 1.41 percent, and has been under persistent pressure for over three years now. In December 2008, it dropped as low as 0.74 percent. Things are not as bad, but going by Chart 4, things are not hunky-dory either.
Once again, all this circles back to Charts 1 and 2, and why businesses do not see the need to aggressively plan for capex. This is not likely to change anytime soon.
Thanks for reading!
