
U.S. stocks have come a long way.
February last year turned out to be a major low (black arrow in Charts 1/2/3/4), and after that the November 8 presidential election last year. Performance is not uniform, of course. Some are relentlessly making new highs, while others are stuck in the rut.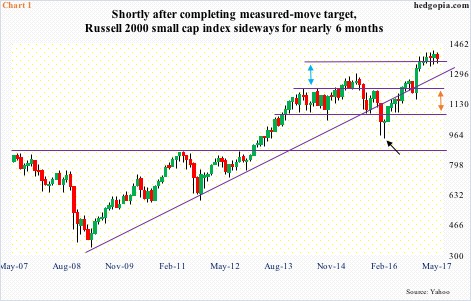
Of the four major indices mentioned here, action in the Russell 2000 small cap index fits the rut category.
The index has been sideways for nearly six months, caught between 1390s and 1340s. It began to go sideways shortly after completing a measured-move target (indicated by orange and blue bi-directional arrows in Chart 1).
Incidentally, if the index convincingly breaks out of the six-month range, using a similar measured-move approach, technicians would be eyeing 1430s. On April 26, it did rally to 1425.7 – a new record. That breakout proved false, followed by a drop back into the range. The measured-move resistance is proving tough to crack.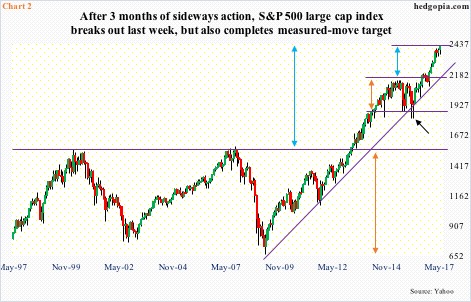
A similar pattern has unfolded on the S&P 500 large cap index.
Back in March 2013, the S&P 500 had a major breakout – past prior two peaks of March 2000 and October 2007 (Chart 2). Each of those prior two peaks preceded bear markets, with support at 769 and 667 respectively.
A measured move of the peak-trough distance (orange bi-directional arrow) from the 2013 breakout extends to just north of 2400, which is where the index is at currently (blue). In other words, the pattern is complete.
Within this larger timeframe, another mini pattern extends to the same target. Last week’s mini-break out of 2400 followed nearly three months of sideways action.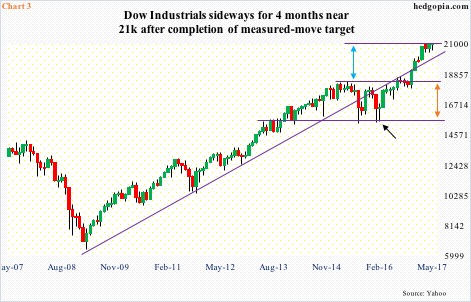
The Dow Industrials, too, has been sideways since it hit an all-time high of 21,169.11 on March 1. That high is yet to be surpassed. Last Thursday came close, rallying to 21,112.32, also kissing the daily upper Bollinger band.
One possible reason why the S&P 500 was able to surpass the March 1 high, while the Dow is still below it is that the latter has already completed its own measured-move target (Chart 3). Hence the essentially sideways action the past four months at/near 21,000.
A similar pattern just got completed on the Nasdaq 100 (Chart 4). It took a 2.4-percent rally last week.
Of the four indices, the Nasdaq 100 is the one with most momentum – up 19 percent year-to-date. They all broke out post-election, and are all above a trend line from March 2009 lows. That said, because the trend line is rising, it does not take a big decline before a test occurs.
Hence the significance of the stalled action in Charts 1/2/3.
In this regard, the Nasdaq 100 is probably the one to watch. It has been the strongest of the four but has also reached a zone where resistance is likely. Stalled action right around here is an indication that markets are paying attention to the measured-move pattern. This in due course could potentially create a mismatch between buying (less) and selling (more).
Thanks for reading!
