
NYSE margin debt continues to deflate.
Right before the 2008/2009 bear market ended, margin debt shrunk to $173.3 billion in February 2009. It then gradually rose.
The previous high of $381.4 billion in July 2007 was surpassed in April 2013 ($384.4 billion).
Until it peaked last April at $507.2 billion, persistent increase in margin debt provided a big tailwind for stocks. The S&P 500 index peaked a month later, in May last year. Since that April peak, margin debt has declined by $59.5 billion. In January this year, it fell by $13.5 billion month-over-month to $447.7 billion – the lowest total since the April peak.
Margin debt has now turned into a headwind for stocks, and has potential to get a lot worse.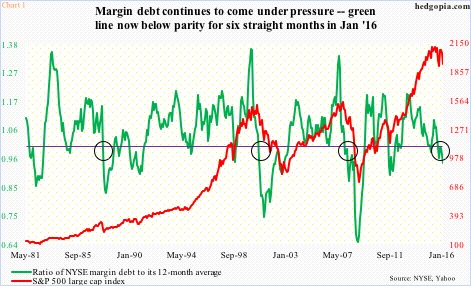
Chart 1 calculates a ratio of margin debt to its 12-month average and plots it against the S&P 500. For the past six months, margin debt has been below its 12-month average. Momentum is running dry.
Indeed, in Chart 1, once the green line drops below parity, and the trend sustains, stocks suffer. This was true in 1987, 1990, 2000 and 2008. January’s ratio was 0.94 – the smallest of the six. Continuation of this trend is bound to create headwind for stocks.
What are the odds? Pretty decent.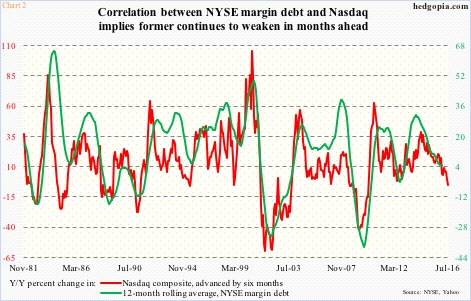
In Chart 2, the Nasdaq composite is pitted against 12-month rolling average of margin debt. Year-over-year percent change is calculated for both, and the Nasdaq’s is advanced by six months. The correlation is pretty tight between the two, which, if maintained, implies continued pressure for the green line in the coming months.
Besides stocks, this phenomenon can have repercussions elsewhere.
Turns out, margin debt tends to strongly correlate with U.S. banks’ commercial & industrial loans. In fact, R between the two over the last 35 years is 0.96 (Chart 3). Damn tight!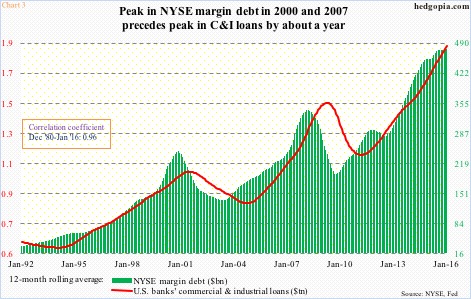
It is hard to imagine why the two would correlate, except for the fact that both sets of borrowers have to have willingness to take on risk. Or maybe some other reason (s). What matters is that the two follow each other.
Interestingly, margin borrowers tend to lead their C&I cousins by about a year.
In this respect, if this relationship holds, it will be a while before the 12-month moving average of C&I loans peaks.
The green bars in Chart 3 are probably in the process of peaking soon. The 12-month rolling average made a new high in January, but has been stuck in the $476-billion range the past three months – going sideways, give and take, for the past several months.
C&I loans are still trending higher. But once again, the pace may be slowing down. January only saw a m/m increase of $11 billion, to $1.98 trillion, following increases of $22.6 billion in November and $18.9 billion in December last year.
Recall that margin debt peaked last April. So deceleration in C&I loans is expected, and we are seeing that. Needless to say, this will have implications for the economy down the line.
A lot is riding on margin debt – from stocks to C&I loans to the economy – and the trend is not going the right direction.
Thanks for reading!
