
November NYSE margin debt increased 3.4 percent month-over-month to $500.4 billion. This is the fourth time in the series’ history it has crossed $500 billion. The first one occurred in April 2015 when debt rose to $507.2 billion – a record.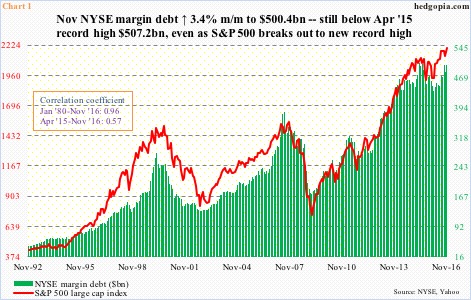
Chart 1 plots margin debt with the S&P 500 large cap index. The latter has broken out to a new high, the former not.
Evidently, since margin debt peaked in April last year, the correlation between the two has weakened to 0.57, versus near-perfect 0.96 going all the way back to January 1980.
That said, that peak was immediately followed by a peak in the S&P 500 in May (2015). Later this year, U.S. stocks notched an important bottom in February. Margin debt, too, bottomed at $435.8 billion in that month. Since that low, the S&P 500 has not only surpassed the May 2015 high but has gone on to record several more highs. Margin debt is essentially sideways since the April 2015 peak, give and take.
Is this a potential problem for stocks? Possibly, unless other sources of funds step up to the plate.
Simplistically, the rally in stocks has failed to coax the bulls into taking on more debt – more than they took in April 2015, even as the S&P 500 is nearly eight percent higher.
This can prove to be an important factor in the weeks/months ahead.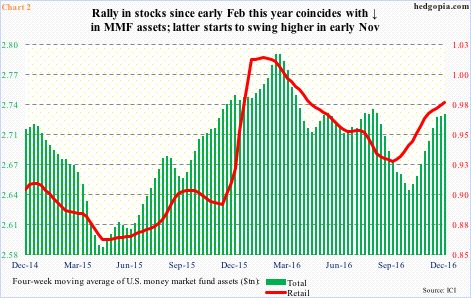
One reason is that money-market-fund assets have been inching higher.
As stocks were in the process of bottoming in February this year, the four-week moving average of money-market-fund assets peaked at $2.79 trillion in mid-March, and retail assets at $1.02 trillion in mid-February. The drop since provided a nice tailwind for stocks.
Fast forward to now, and they have both been rising. Total assets bottomed at $2.65 trillion in late October, and stood at $2.75 trillion last week (Chart 2). Much of this is probably due to funds coming out of bonds, but is worth watching nonetheless.
Indeed, post-election, stocks have been a magnet for new funds. From November 9 through this Wednesday, for instance, SPY (SPDR S&P 500 ETF), IWM (iShares Russell 2000 ETF), and QQQ (PowerShares Nasdaq 100 ETF), attracted $20 billion, $6 billion, and $2.5 billion, in that order (courtesy of ETF.com).
This, among others, has helped offset the rather subdued increase in margin debt, but at the same time flows are beginning to decelerate. In the week ended Wednesday, SPY saw inflows of $606 million. But that just about offset the $584 million in outflows in the prior week.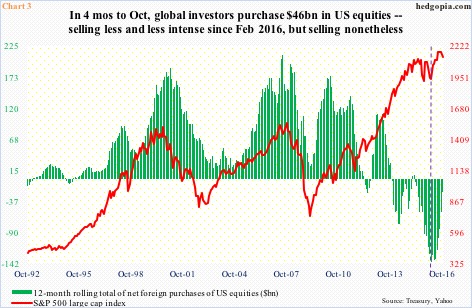
Could foreigners step up to the plate?
Well, they have been. Sort of.
On a rolling 12-month basis, foreigners are still net-selling U.S. equities – this stood at minus $21.7 billion in October. But as early as February this year, they were selling $138.9 billion worth. From this perspective, things have improved. Incidentally, the green bars in Chart 3 began to move up since February. As noted above, U.S. stocks bottomed in that month.
Stated differently, the trend among foreigners is in the right direction. In the four months to October, they purchased $46.1 billion worth. But having diverged from the red line for quite a while, the green bars have a lot of catching up to do.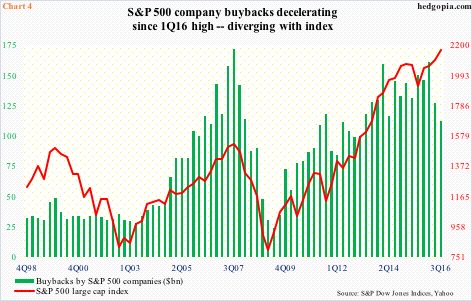
All this is unfolding as corporate buybacks – a bulwark of support for the current bull market – have slowed down, although from a torrid pace. In 3Q16, buybacks by S&P 500 companies were $112.2 billion, versus $161.4 billion in 1Q16. The latter was the second highest behind $172 billion in 3Q07 (Chart 4).
Once again, the red line in Chart 4 has diverged from the green bars. This cannot continue. Either other sources of funds need to fill the void or buybacks grow again. The problem with the latter scenario is that corporations of late have been chewing more than they can swallow. In five of the six quarters through 2Q16, they spent more in dividends and buybacks than they took in operating earnings (not shown here). In 3Q16, this improved to 85 percent – if we can call this an improvement.
There is one wildcard.
President-elect Trump wants to cut taxes. In the event of a repatriation tax holiday, the likelihood of increased buybacks goes up – duration notwithstanding. In 2004, Congress enacted such a holiday, under which U.S. corporations brought home $362 billion, most of which was spent on dividends and buybacks.
Even if this were to be true, this would just be a one-time boost. Other sources of funds need to move in sync – not the case now.
Thanks for reading!
