
U.S. banks’ commercial & industrial loans dropped $6.5 billion month-over-month in August to a seasonally adjusted annual rate of $2.06 trillion (Chart 1).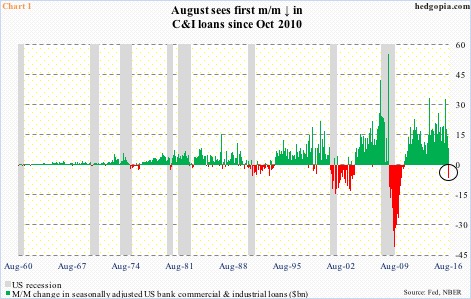
These loans have come a long way – rising from a cycle low of $1.18 trillion in October 2010 to the July peak this year. Earlier in October 2008, they peaked at $1.59 trillion.
The August drop is just one month. One month does not make a trend. That said, m/m growth has been decelerating since March this year, when loans jumped $33.1 billion m/m.
One problem is inventory that was accumulated in the past is being consumed.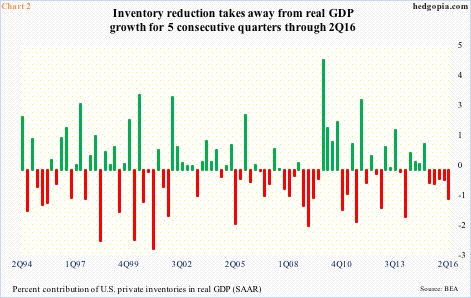
In 2Q16, inventory reduction subtracted 1.16 percent from real GDP growth. GDP grew at an annual rate of 1.4 percent in that quarter, and by 0.8 percent in 1Q16, 0.9 percent in 4Q15, two percent in 3Q15 and 2.6 percent in 2Q15. In all these remaining four quarters, inventory reduction has negatively impacted GDP growth (Chart 2).
Activity is expected to snap back in the third quarter. As of Wednesday, the Atlanta Fed’s GDPNow model is forecasting real GDP growth of 2.2 percent. Assuming this growth is aided by inventory build, among others, C&I loans can pick back up from recent deceleration, not to mention the August drop in particular.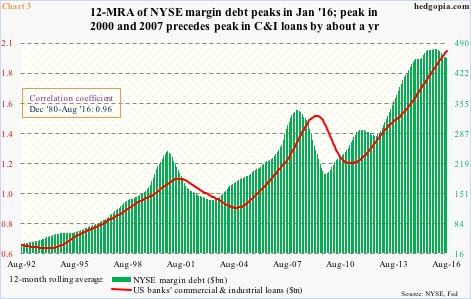
In this respect, Chart 3 is relevant. It pits NYSE margin debt with C&I loans, using a 12-month rolling average. The two seem to correlate. Going back to December 1980 through August this year, the correlation coefficient is near-perfect 0.96.
As is evident in Chart 3, margin debt tends to lead – by about a year. Which is how things unfolded in the last two recessions. This time around, the green bars peaked in January this year. So if historical relationship between the two holds, the red line should begin to hook down in the early months of next year. Hence the significance of the August drop.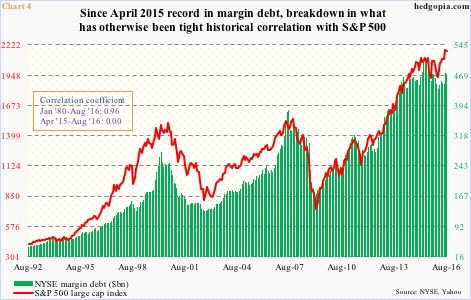
Margin debt, by the way, peaked in April last year at $507.2 billion, then bottomed at $435.8 billion in February this year, with August at $471.2 billion (Chart 4). As is the case with C&I loans, margin debt correlates tightly with the S&P 500. However, since that peak in April last year, the two have ceased to move in tandem. The S&P 500 did peak in May last year before going sideways but it broke out this July to a new high.
Hence, it is entirely possible margin debt has also ceased to correlate with C&I loans this cycle. Barring that, the relationship between the two is worth watching. As is seen in Chart 1, red bars tend to populate during economic contraction.
Thanks for reading!
