
U.S. housing continues to send mixed signals … has been that way for a while. 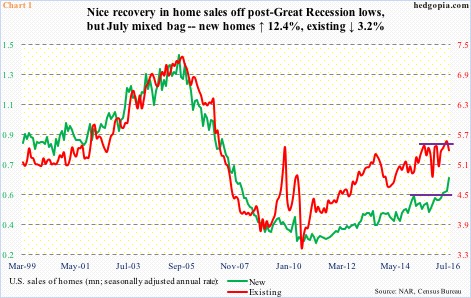
August’s existing home sales will be reported later this morning. July was down 3.2 percent month-over-month to a seasonally adjusted annual rate of 5.39 million units. Although the 5.57-million units in June were the highest since 5.79 million in February 2007 (Chart 1). Until July’s numbers came out, existing home sales seemed to be breaking out of a one-year range, but that was not the case.
New home sales, on the other hand, jumped 12.4 percent m/m in July to a seasonally adjusted annual rate of 654,000 units. These were the highest since 727,000 in October 2007. Sales broke out of one-year range in April, and that momentum has continued (Chart 1). (August’s new home sales are due out next Monday.)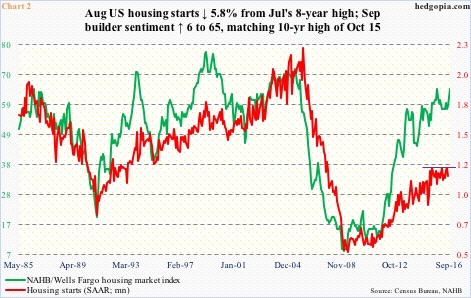
Divergence can also be noticed elsewhere.
The National Association of Home Builders housing market index jumped six points m/m to 65 in September, matching the reading of October last year, which was a 10-year high. Builder sentiment has come a long way (Chart 2). However, they are not putting their money where their mouth is.
Housing starts tend to move in tandem with builder sentiment. Currently, the green line in Chart 2 is way ahead of the red line. In fact, starts declined 5.8 percent m/m in August to a seasonally adjusted annual rate of 1.14 million units. July was 1.21 million, matching February 2016/June 2015. Evidently, starts had been going sideways for a year before the August drop … means no breakout.
In the past, as the gap between starts and builder sentiment widens, it eventually gets resolved with the latter dropping to meet with the former.
That said, builder sentiment in Chart 2 is as of September, and starts as of August. It is possible starts paint a different picture altogether when September numbers are reported.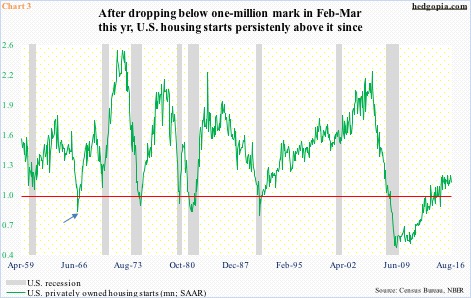
Although lagging builder sentiment, starts have made quite a comeback since the early months this year. In February and March, they fell below the one-million mark. In the past eight recessions, only once did starts drop below one million units without causing a recession. That was in 1966 (arrow in Chart 3).
But a drop below one million does not have to happen for a recession to kick in. In the ‘60/’61, ‘69/’70, and ’01 recessions, starts were well above one million.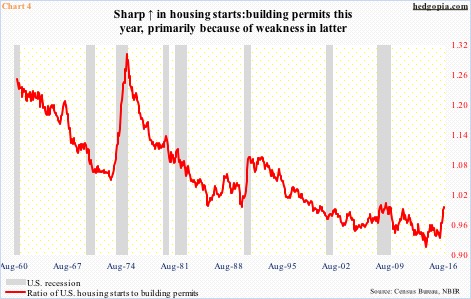
Chart 4 offers more perspective on this. The red line is a ratio between starts and building permits, and has had a sharp rise from .935 in January this year to .997 in August. This is primarily because permits, which are in the denominator, have been much weaker, not the other way around.
Building permits peaked at a seasonally adjusted annual rate of 1.33 million units in June 2015, and were 1.14 million this August. The June high was the highest since 1.36 million in July 2007. In general, permits tend to be forward looking. If weakness persists, this will ultimately impact starts, and builder sentiment.
Hence the significance of today’s existing home sales and the new home sales next Monday.
Thanks for reading!
