
Having rallied seven-plus percent in the past five months, there is a spring in the US dollar index’s step, but it is unlikely to break out of a year-and-a-half range any time soon.
The two-year Treasury yield tends to be sensitive to the Fed’s monetary policy forecasts. It rallied from 0.56 percent in early July this year to 0.87 percent on October 11, before losing ground a tad. Last Friday, it closed at 0.84 percent.
Markets currently expect a 25-basis-point hike in the December 13-14 meeting. (The FOMC also meets November 1-2, but a move is unlikely. U.S. presidential election falls on the 8th.)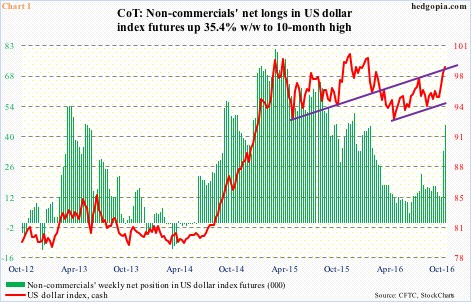
Prospects of higher rates have helped the US dollar index, which has been rallying since early May, when it bottomed at 91.88. Since that low, it has been making higher lows. At the time, non-commercials acted as if they did not think the strength was for real.
In March last year, these traders held as many as 81,270 net longs in US dollar index futures (Chart 1). That was the all-time high. The peak approximated a peak in the cash at 100.75 in the middle of that month. Net longs then dropped all the way to 4,692 contracts in the middle of June this year, with only a slightly up bias since … until two weeks ago.
In the past couple of weeks, non-commercials have aggressively added to net longs – from 12,100 to 45,422 – to a 10-month high.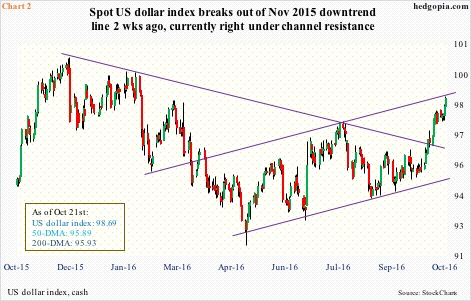
In the meantime, cash US dollar index has broken out. In late November last year, it unsuccessfully tested that March 2015 high, before proceeding to chart out a succession of lower highs. The November downtrend line was broken two weeks ago (Chart 2).
The dollar index is now past both 50- and 200-day moving averages, with the former now rising and the latter slightly down. There potentially is a golden cross in the making.
If the index is already responding this way to talk of a rate hike, how would it react when the Fed actually raises rates? Or would it be a case of ‘buy the rumor, sell the news’? That likely depends on how the spot behaves between now and the December meeting.
Since that March 2015 peak, which followed a 25-percent rally in nine months, the dollar index has essentially traded within a range – 100-plus on the up and 93-plus on the down. A break either way has the potential to have massive ramifications – across global assets. As things stand, the path of least resistance is currently up – toward the upper end of the range. But a breakout? Markets do not expect one, at least not now.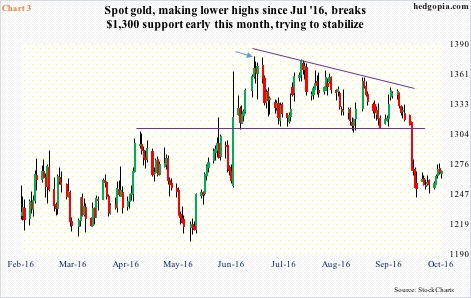
First and foremost, non-commercials would probably be a lot more aggressive if they expected a breakout (Chart 1). And gold would probably begin to act weaker.
In reality, spot gold has been under pressure since early July this year when it peaked at $1,377.5/ounce (arrow in Chart 3). It then went on to make a series of lower highs before dropping 3.3 percent on October 4. That breakdown caused the yellow metal to lose support at $1,300 … tough to say whether it was cause or effect.
Of late, even though the dollar has rallied, gold is trying to stabilize, trading around its rising 200-day moving average in the past 11 sessions. The 50-day is dropping – currently $1,312.2, which is 3.5 percent away. A tug of war is likely around $1,300. On a daily chart, the spot just completed a bullish MACD crossover.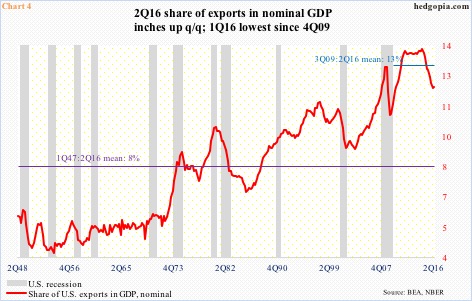
Here is what markets seem to be betting on – that continued strength in the dollar will be taken by the Fed as stealth tightening. Or that it would begin to seriously impact the U.S. economy – in an adverse manner, of course – which would force the Fed to soften its tone.
We need look no further for proof than exports.
Nominal U.S. exports rose 1.4 percent sequentially in 2Q16 to a seasonally adjusted annual rate of $2.21 trillion. This follows three consecutive quarter-over-quarter decline – and in five out of six quarters. Exports peaked at $2.39 trillion in 3Q14. As a percent of nominal GDP, exports made up 12 percent in 2Q16, versus 13.8 percent in 2Q14. The rapid drop in the red line in Chart 4 is ominous-looking. A breakout in the US dollar index probably ensures that it continues lower.
In this respect, it is probably time to be on the lookout for signs of fatigue for shorting opportunities. Thus far, momentum is intact on the US dollar index. Shorter-term moving averages continue to rise. On a weekly chart, there may still be some room to rally. That said, the daily chart is way overbought, which needs to/will be unwound in due course.
Thanks for reading!
