
One of the hallmarks of the current U.S. recovery has been conflicting signals coming out of the job market.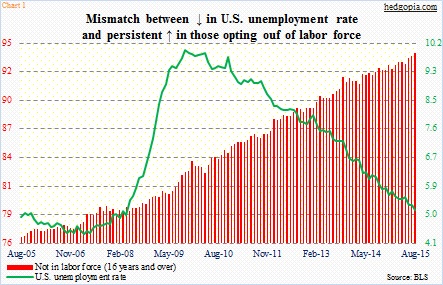
The unemployment rate is low – nearly cut in half from 10 percent in October 2009 to 5.1 percent in August. But the number of Americans opting out of the labor force has steadily increased – from 82.8 million to 94 million (Chart 1).
A total of 11.3 million non-farm jobs has been created since July 2009, yet average hourly earnings of private-sector employees are yet to come under sustained upward pressure. Throughout the recovery, they have been range-bound. The last time wages grew with a three handle annually was in April 2009 (Chart 2).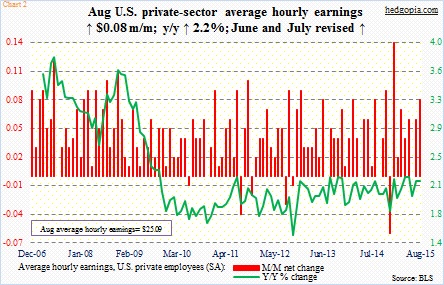
In this context, what we see in Chart 3 probably should not come as a surprise. More and more Americans 65 years and over are joining the workforce. By August, their ranks stood at 8.4 million, slightly below May’s 8.5 million, but substantially higher than when the recovery began. In July 2009, they numbered six million. Throughout the recovery, the green bars in the chart have persistently moved from the lower left to the upper right. As a result, this age group has been taking a bigger share of the overall employed pie – from 4.3 percent back then to 5.6 percent in August.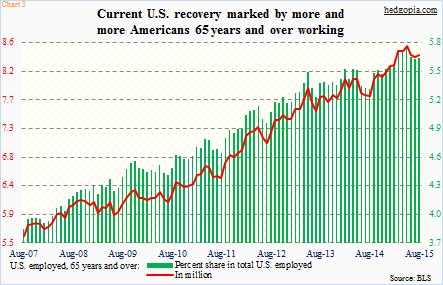
At age 59 ½, Americans can start taking money out of their IRA accounts in any amount they want. U.S. life expectancy is 79 years, with men at 76 years and women at 81 years. In all probability, the ideal age to retire is in the 60-65 year range. So anyone who is working beyond 65 years is not doing so for fun, but out of need. If they did not have enough to retire on, the propensity to consume would be less than, let us say, those in the 20s and 30s. And this can be problematic.
There are tons of reasons as to why consumer spending is rather sluggish – from dismal wage growth to leveraged consumers to low savings rate. The red line in Chart 4 represents the year-over-year increase in personal consumption expenditures. In the current recovery, it peaked at 5.3 percent in July 2011 and only once has it grown with a five handle since (at five percent in August 2014). The deceleration is most evident since that second peak (arrow in the chart).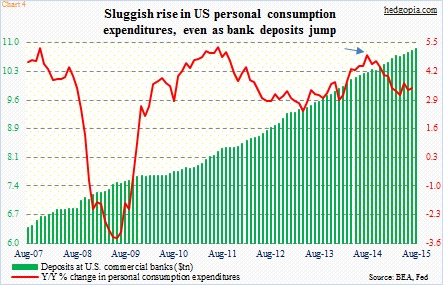
Might there be a connection between sluggish consumer spending and the rather inordinate increase in the number of older workers? It is hard to establish a relationship, but it for sure has not helped. Their propensity to save is probably on the high side. In Chart 4, the green bars represent deposits at U.S. commercials banks. They have grown from $7.5 trillion in June 2009 to $10.9 trillion in August. While not suggesting this is primarily due to older workers socking away their savings, the red line in the chart does not get help from this – and unlikely to change any time soon.
Thanks for reading!
