
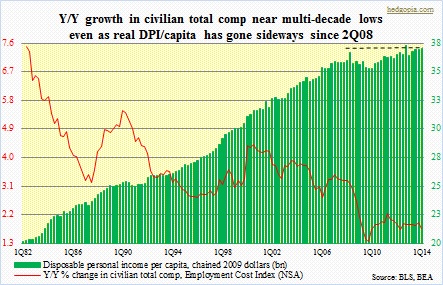
 One of the ways the current U.S. economic recovery has seriously diverged from past recoveries is the lack of solid progress on the wage front. In May, year-over-year percent change in average hourly earnings of private-sector employees (seasonally adjusted) came in at 2.1 percent. For over four years now, this metric has hugged the two-percent-growth line, give and take, even as the economy has added nine million jobs. The lack of progress is even more somber in real terms. In January 2010, average hourly earnings in 1982-1984 dollars (private-sector employees) was $10.31, a penny more than in April this year. As the accompanying chart shows, real disposable personal income per capita was $37k in 1Q14, vs. $37.3k in 4Q12 and $36.7k in 2Q08. The point is, when incomes are not rising, it only makes sense that consumers either dip into savings or take on debt.
In a buyer’s market, employers will have the final say. This is evident in Employment Cost Index data. Y/Y percent growth in civilian total compensation is near multi-decade lows. Sure, back in the ‘80s, comp growth was much higher as it needed to keep up with rampant inflation. But the current sub-two-percent growth is more than a point lower than even what was prevalent in the quarters leading up to the 2008/2009 recession.
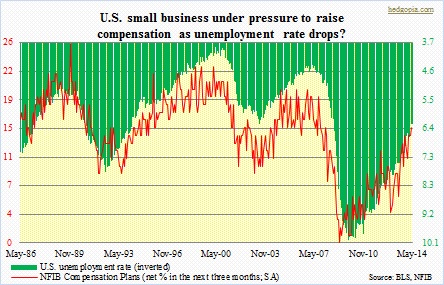 In this context, the May edition of the National Federation of Independent Business survey is generating some optimism. First of all, the index of Small Business Optimism posted another gain – third in a row. Before we get too excited by this, one caveat is that even though the index is at the highest level since September 2007, the 96.6 reading is still below average. The NFIB also points out that virtually all of the gain came in expectations for sales and for business conditions – not good. It would be a lot better if larger contributions came from, let us say, capital spending or hiring plans. With that said, optimists can find solace in the accompanying chart in the sense that survey respondents’ compensation plans closely track the nation’s unemployment rate. The May reading matches the high back in March 2008 and is the strongest since October 2007, when it read 17. So if the U.S. economy performs as well as equity bulls/economy optimists would have us believe, then compensation is bound to have better days ahead. This blogger is not quite sold into this optimism, nevertheless has an open mind about it.
