
Back in the week ended July 5 this year, non-commercials enthusiastically held 315,963 net longs in gold futures. That was an all-time high. These traders had been aggressively building positions since the week ended December 1 last year, when net longs bottomed at 9,750 contracts; spot gold bottomed at $1,045.4/ounce on the 3rd that month.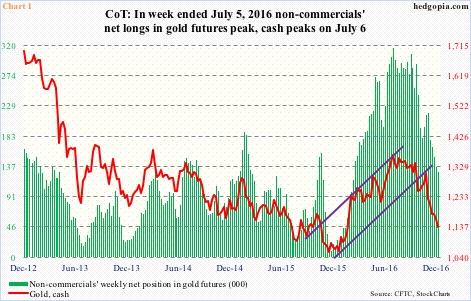
By July 6 this year, the metal had rallied all the way to $1,377.5, and peaked. Incidentally, 10-year T-note yields reached a historic low 1.34 percent in that very session. This, of course, as stated above, coincided with the peak in non-commercials’ net longs.
Having caught the low last December, these traders apparently hoped the rally would continue and were positioned accordingly. Once the metal peaked in July, so did their net longs. Non-commercials’ excess optimism needed to be unwound, and it has. The metal traded at $1,137.4 last Friday, and net longs dropped to 129,311 by last Tuesday (Chart 1).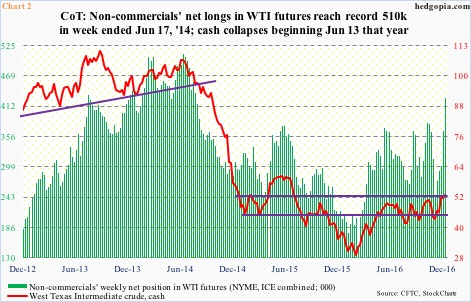
A similar phenomenon could be seen in WTI futures.
On June 28, 2012, spot West Texas Intermediate crude reached an important bottom at $77.28/barrel. This coincided in the week through June 26 that year with a bottom in non-commercials’ net longs at 139,975 contracts. Then both rose.
Net longs peaked at record 509,833 in the week ended June 17, 2014; the cash peaked at $107.68 on the 13th that month. We know the rest. The crude collapsed. Non-commercials followed along, cutting back their net longs. Their excessive optimism needed to be unwound. And unwind it did.
By February 11 this year, spot WTI bottomed at $26.05, and by the week ended February 16, net longs bottomed at 152,814 contracts (Chart 2). Quite a drop from that June 17, 2014 peak!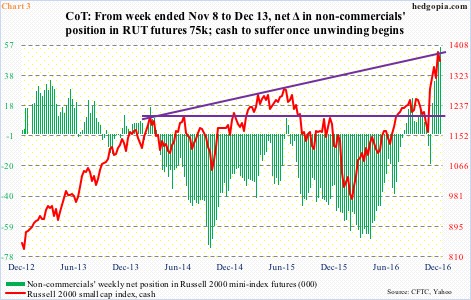
Why bring this up?
There is a lesson here. When things get overly bullish/bearish – meaning everyone has jumped on board – the opposite tends to happen.
Russell 2000 mini-index futures presently may very well be going through this phase.
As of last Tuesday, non-commercials accumulated the most net longs in these futures. In the past five weeks, holdings have gone from net short 18,999 contracts to net long 55,949 – for a net swing of nearly 75,000 (Chart 3).
Now, it is always possible for those green bars in Chart 3 to continue to get taller. Momentum begets momentum. That said, each incremental increase also raises the risk of a reversal.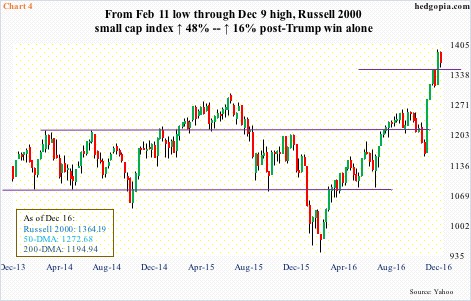
As was the case with both gold and crude oil, once a process of unwinding begins in futures, the cash suffers. What are the odds of this happening with the Russell 2000 index?
The index has come a long way, that is for sure. From the February 11 low this year through December 9 (all-time high 1392.71), it jumped nearly 48 percent – and 16.5 percent since Donald Trump was elected president (Chart 4).
Since the election, stocks have responded favorably to the president-elect’s focus on tax cuts, less regulations, and increase in infrastructure spending. Rightly or wrongly, markets’ collective wisdom has decided that small-caps stand to win the most in this scenario.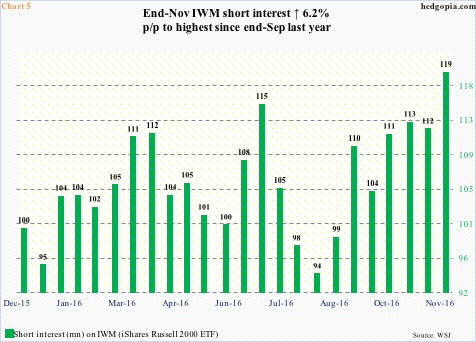
In fact, small-caps’ gains would probably be even bigger if not for shorts.
Short interest on IWM, the iShares Russell 2000 ETF, began to rise from mid-August this year when it was 94.1 million shares. The Russell 2000 bottomed on November 3 near its rising 200-day moving average, and, as stated above, took off post-election. IWM short interest went from 112.9 million at the end of October to 119.1 million end-November (Chart 5). In other words, the nearly parabolic rise in the index/ETF during the period did not dissuade the shorts from adding.
Shorts are not buying the rally – as simple as that – and in doing so they are fighting non-commercial traders as well as the recent trend in flows.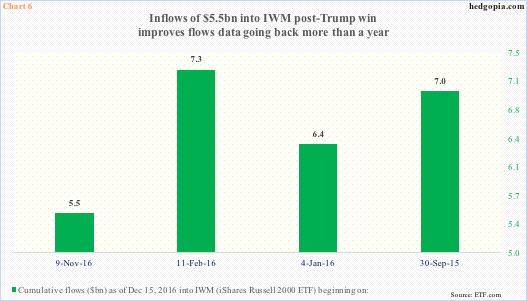
Post-election, inflows into stocks have improved. In the week through Wednesday last week, $6 billion moved into U.S.-based equity funds – and $28.2 billion in the past six weeks (courtesy of Lipper.com).
Similarly, between November 9 and December 15 this year, $19.9 billion moved into SPY, the SPDR S&P 500 ETF, $1.7 billion into QQQ, the PowerShares Nasdaq 100 ETF (a laggard), and $5.5 billion into IWM, the iShares Russell 2000 ETF (courtesy of ETF.com).
In fact, the post-election inflows into IWM have improved the overall inflows trend going back more than a year. For instance, from February 11 through November 8 (election day), IWM only attracted $1.8 billion. Add the $5.5 billion post-election, and flows improve to $7.3 billion. In Chart 6, all four dates are important in their own right.
If this trend in flows continues, odds of a short squeeze grow, and non-commercials likely will continue to ride the trend.
Here is something to consider.
In the first three sessions last week, IWM attracted $2.5 billion, but the ETF went on to lose 2.3 percent in those three sessions. This is where the risk lies. Even a pause – let alone a reversal – can potentially test the patience/mettle of particularly new investors/traders.
Once signs of distribution show up, non-commercials’ temptation to cash in on their longs grows. There is a decent amount of profit waiting to be locked in on this thing.
For now, these traders are probably focused on 1347 on the cash. This level also corresponds with the 20-day moving average. And once there, it would have already broken the 10-day moving average.
In this scenario, the risk of unwinding those net longs grows. Momentum begets momentum – only this time it would be to the other direction.
Thanks for reading!
