
 In many ways, this cycle has been like none other. Equities continue to grind higher. Multiples (valuation) continue to expand. The Fed continues to provide support – both monetary and verbal. Equity bulls continue to throw the caution flag out the window. The Fed continues to taper; nevertheless, long bonds continue to get bid up. The U.S. economy continues to send out mixed signals, yet optimists continue to expect a much stronger second half. Corporate-profit margins continue to look like they have peaked – in 1Q14, share of corporate profits (with inventory valuation and capital consumption adjustments) in national income dropped to 13.5 percent, versus 14.7 percent quarter-over-quarter. The last time margins were as high was back in 4Q11 and has been more or less range-bound since. Sentiment indicators continue to stay extended – some way extended. Bears continue to maintain their bearish bias. And last but not the least, margin debt continues to stay elevated.
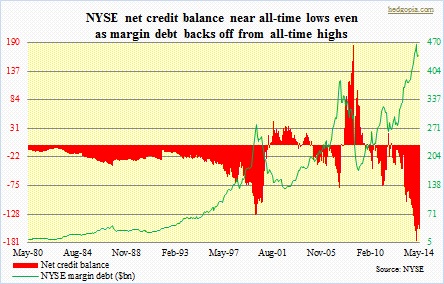
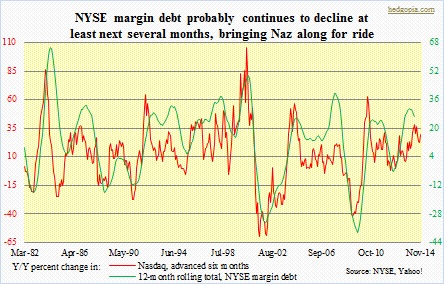 The chart above shows how extended this metric is. Net credit balance (‘free credit cash accounts’ plus ‘credit balances in margin accounts’ minus ‘debit balances in margin accounts’) has never been as negative. The May total of -$155bn is smaller than February’s -$177bn, but shows the amount of imbalances therein. Like several other overextended metrics, margin debt is one of those that could have potentially begun a process of correction a long time ago. Back in July 2007, it peaked at $381bn; at the time, margin debt as a percent of disposable personal income was 3.61. So come July of 2013 when it came in at $382bn, the prevailing thinking was that it could not go any higher. But it did. The Fed continued to indirectly urge market participants to get on the risk curve, which they of course obliged. By February this year, margin debt rose all the way to $466bn, even as margin debt as a percent of disposable personal income stood at 3.67 (versus 3.06 in July 2013). Both have since edged down. Do we have a peak then? We will see, but odds have risen. Incidentally, as the accompanying chart shows, there is an interesting relationship between 12-month rolling total of margin debt and the Naz, advanced by six months. They track each other well. If this relationship holds, this is how it is setting up – pressure on margin debt until September, and then a pickup. The thing is, it is all good insofar as this process is orderly. A lack thereof raises the odds of a margin call, which has the potential to set in motion a sell-fulfilling corrective mode.
