
The U.S. economy has grown sub-par post-Great Recession – an average of 2.1 percent versus a long-term average of 3.2 percent going back to 2Q47. In the past four quarters, it has not even managed to grow at 2.1 percent – two percent in 3Q15, 0.9 percent in 4Q15, 0.8 percent in 1Q16, and 1.2 percent in 2Q16. Weak end-demand is the real culprit. And then there is inventory.
All the inventory that was being accumulated in prior quarters is being run down.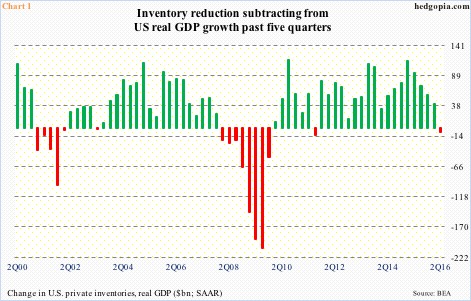
In 2Q16, inventory reduction took away 1.16 percent from real GDP growth. In fact, this was the fifth consecutive quarter inventory contributed negatively to growth. In other words, stocks are in decline. In 1Q15, inventory increased by $114.4 billion. Come 2Q16, it declined by $8.1 billion (Chart 1).
A similar phenomenon is also evident in Chart 2. In it, U.S. banks’ commercial & industrial loans are pitted against a ratio of inventories to sales in manufacturing and trade. Sales peaked at a seasonally adjusted annual rate of $1.35 trillion way back in August 2014. Inventories kept rising, to a new high $1.81 trillion in May this year, although they have been flattish since June last year. In the meantime, sales have improved from $1.28 trillion in February to $1.29 trillion in May this year.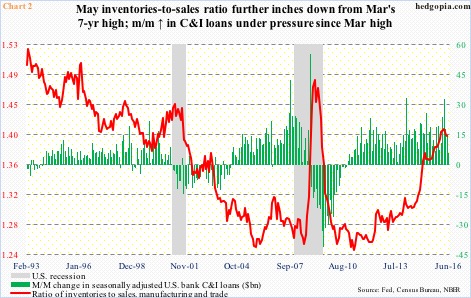
As a result, the red line in Chart 2 has hooked down from a seven-year-high 1.412 in March this year to 1.401 in May. Encouraging, but here is the rub. The ratio is so elevated it probably takes a lot to deplete all this accumulated inventory. In keeping with the decline in inventory, C&I loans have dropped month-over-month since March this year, although on an absolute basis they rose to a record $2.06 trillion in June.
Will the red line in Chart 2 continue lower? It is tough to say. Likely not is the safe answer.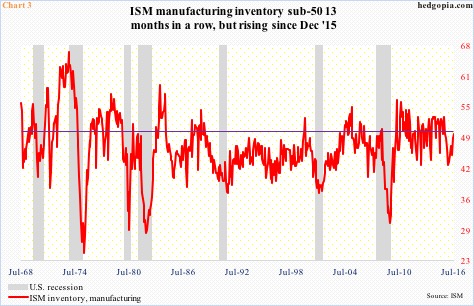
The Institute of Supply Management this Monday put out its manufacturing survey for July. Inventory rose a point to 49.5. Since the sub-index peaked in June last year at 53, it has remained under 50. November last year dipped to 43 – matching December 2012 – before rising; July is a hair’s breadth away from 50, which indicates expansion (Chart 3).
The bottom line is that U.S. companies may be running down their stockpiles, but unless end-demand jumps big time – not a base case on this blog – progress will be slow, with the risk that inventory will begin to accumulate once again as companies get ready for second-half festivals/shopping season. This has been going on for several years. Expectations run high, inventory gets accumulated, but does not get consumed.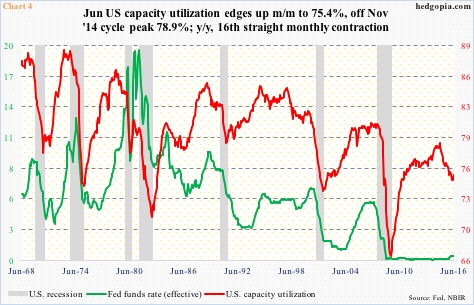
One need only look at Chart 4 to get a sense of how suppressed activity has been. In the current cycle, capacity utilization peaked at 78.9 percent in November 2014, then dropping all the way to 74.8 percent in March this year before rising a tad. Utilization has dropped for 16 straight months year-over-year … did not even cross 80 percent when things were humming along, and is not responding to interest rates which have stayed near zero for nearly eight years now.
This is the kind of cycle we are in, and is not likely to change any time soon. Any time inventory is accumulated, odds favor it gets run down in due course than consumed.
Thanks for reading!
