
Through Wednesday, three major U.S. banks have reported third-quarter results, and if there is one common theme, it is the top line. There is no growth.
JPMorgan Chase (JPM) reported revenues of $23.5 billion, versus $25.1 billion last year. For Bank of America (BAC), revenues were $20.7 billion, versus $21.4 billion, and for Wells Fargo (WFC) $21.9 billion, versus $21.2 billion.
To quote BAC CEO Brian Moynihan: “Revenue growth remains challenging in this interest rate environment.”
JPM was hurt by trading, among others, with management saying the trading slump has continued in this quarter. WFC does not rely much on trading. In fact, it is the largest mortgage lender in the nation. These banks are not all cut from the same cloth. But ultimately it boils down to loan growth.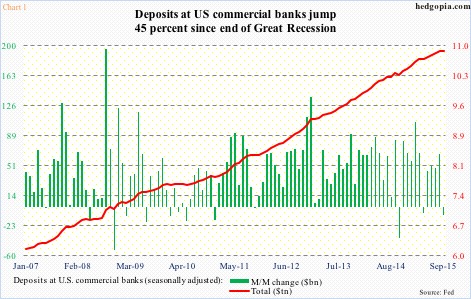
Chart 1 throws light on deposit growth at U.S. commercial banks since the end of Great Recession, and it has been phenomenal. Deposits were $7.5 trillion in June 2009, rising to $10.9 trillion by September this year. Annual growth has softened a bit – was 5.1 percent last month, versus eight percent in May last year – but this is still a healthy growth rate.
This is one side of the coin. Chart 2 portrays the other side. The red line represents commercial banks’ loans and leases, which peaked at $7.3 trillion in October 2008, bottoming at $6.5 trillion in February 2010. There was another dip into March 2011, before steadily rising. Last month, loans were $8.4 trillion. All good, except for the persistently declining green bars in the chart.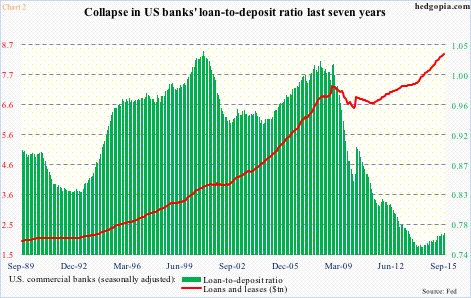
The loan-to-deposit ratio has relentlessly dropped – from 1.02 in November 2008 to 0.752 in January last year. The ratio has been rising since that low, but remains very weak historically. The mean going back to January 1973 is 0.861; September was 0.773.
If there is any consolation in all this, it is this. Year-over-year, loans have been growing faster than deposits for a year now. Last month, they respectively grew 7.6 percent and 5.1 percent.
One category that has been registering good growth is commercial & industrial loans. Back in October 2008, they peaked at $1.59 trillion, and bottomed at $1.18 trillion two years later. Since November 2010, each month has witnessed a sequential increase, to $1.91 trillion last month, evident in the green bars on the right side of Chart 3. The chart pits these loans with the ratio of inventories to sales.
And there is the rub.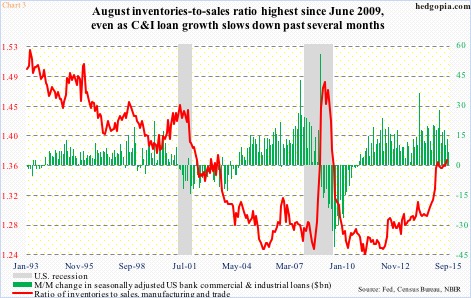
The red line in Chart 3 is problematic. Top-line growth leaves much to be desired, even as inventory build has continued. In August, the ratio was at the highest level since June 2009. As producers await consumption of these inventories, they don’t need be in the market for loans, at the same level as they were in the past. Year-over-year growth in C&I loans was 10.6 percent last month, versus 13 percent as early as this January.
This is one major problem facing these – and other – banks. Tepid is the best way to describe it – demand for loans, that is. Else, they would not be sitting on $2.5 trillion worth of excess reserves – a by-product of the Fed’s quantitative easing – earning 25 basis points (Chart 4). And in a deleveraging cycle it does not look like there is going to be a change in these dynamics any time soon.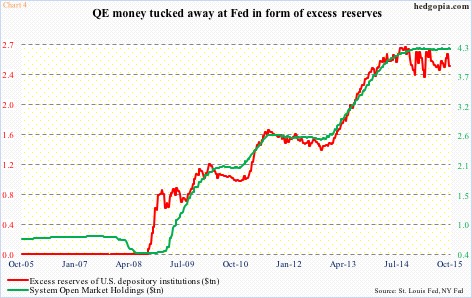
Consequentially, they will do their best to beat on the bottom line using cost-cutting, financial engineering, and what not, but these measures only go so far.
Ultimately, the green bars in Chart 2 need to pick up steam.
Thanks for reading!
