
Over the weekend, non-OPEC producers agreed to cut crude output by 558,000 barrels per day, of which Russia would reduce by 300,000 b/d. This followed OPEC’s November 30 decision to cut output by 1.2 million b/d.
The deal goes into effect January 1, and is good for six months. Assuming there is full compliance, we are talking reduction of 1.7 mb/d. No chump change.
Not surprisingly, both West Texas Intermediate and Brent crude rallied Monday, with the former jumping as much as 5.8 percent intraday, but unable to hang on to the gains. By close, it was up 2.5 percent to $52.83/barrel.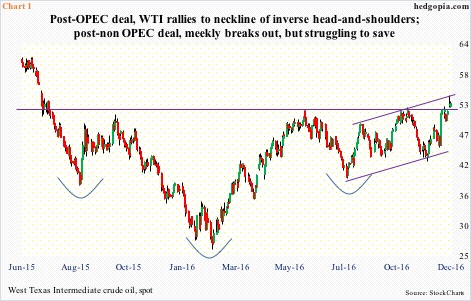
Spot WTI ($52.98) sits at a crucial stage. It has more than doubled from the early February low of $26.05. The journey since has been characterized by higher lows, simultaneously carving out the right shoulder of an inverse head-and-shoulders pattern (Chart 1). Should it break out convincingly, technicians would be aiming at $78. The last time the crude was at that level was two years ago.
Initially on Monday, it looked like the WTI was indeed breaking out, but ended up producing a weekly shooting star. This followed a weekly doji last week.
Amidst these signs of fatigue, what is the likelihood of a genuine breakout?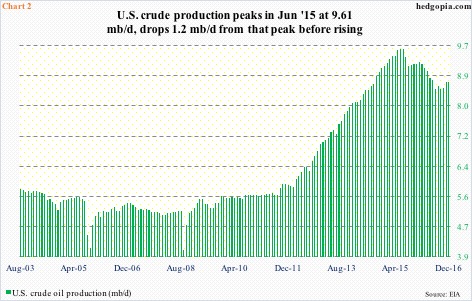
On Monday, Nigeria’s petroleum minister was interviewed on Bloomberg. One comment jumped out. He said oil prices at $60/barrel would be ideal for OPEC. The Brent crude jumped as high as $57.89 in that session, before closing up 1.9 percent to $55.42.
Nigeria has a point.
Back in November 2014, when Saudi Arabia essentially blocked an OPEC output cut, it probably wanted to hurt U.S. shale. U.S. production was at nine mb/d at the time, having witnessed phenomenal growth over the years. In the early months of 2008, production was in the neighborhood of five mb/d.
OPEC’s strategy did not quite pan out. Turns out U.S. shale was much more resilient than many thought. Production kept rising, until it peaked at 9.61 mb/d in June last year (Chart 2). At the bottom early July this year, they were producing 8.43 mb/d. So from peak to trough, production contracted by 1.2 mb/d.
For reference, between June 2014 and February 2016, spot WTI fell from $107.68 to $26.05 – down 76 percent.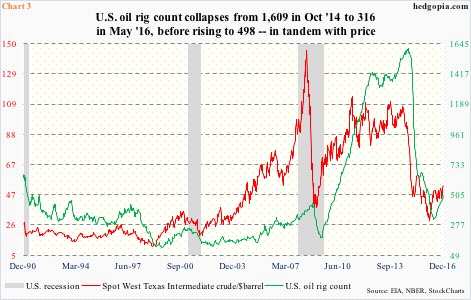
U.S. shale oil’s resiliency is even more impressive considering that U.S. oil rig counts took a swan dive during the period. At the peak in October 2014, a total of 1,609 rigs were in operation. Then they collapsed, bottoming at 316 in May this year. That is a drop of 80 percent in a year and a half.
Once again, spot WTI bottomed in February this year, and as previously noted, more than doubled in price. Rig counts have gone up from 316 to 498 (as of December 9).
Not surprisingly, the green line in Chart 3 follows the red line. Hence the Nigerian petroleum minister’s desire not to let the price of crude get out of hand. OPEC does not want shale oil to come roaring back. Incidentally, since the July low, U.S. production has gone up by 269,000 b/d (as of December 2).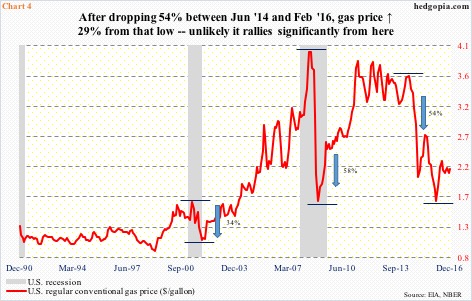
Notably, the drop in the rig count – as severe as it was – did not accompany a recession, as has been the case in the past. It was a mismatch between supply and demand. This is also evident in Chart 4, which plots the per gallon price of U.S. regular gas. Between June 2014 and February this year, gas price dropped by 54 percent, and has risen 29 percent since that low.
A persistent rise in gas price acts as automatic brakes on economic activity. Simplistically, unless there is commensurate growth in income, an extra penny spent on gas gets offset by reduced activity somewhere else. This helps tap down demand. The same way a persistent rise in the price of crude will encourage excess supply, which in the end will end up adversely impacting the price anyway – the Nigerian minister’s point.
Either way you cut it, the odds of spot WTI completing the inverse head-and-shoulders formation are low. All the good news as relates to output cutbacks are in. Markets beginning January will be on pins and needles as to if major producers would comply. Plus, any time news of increase in crude production/rig counts in the U.S. hits, markets likely will interpret that negatively.
Thanks for reading!
