The following are futures positions of non-commercials as of June 9, 2015. Change is week-over-week.
10-year note: Last week, the IMF urged the Fed to delay a rate hike until 2016. This week, the World Bank said the same thing.
For reference, during the taper tantrum, 10-year yields surged from 1.61 percent late April 2013 to three percent by September, resulting in substantial reduction in capital inflows to emerging markets. Currently, these economies already have weak currencies in general. The fear is that a rate hike by the Fed will make matters worse.
Further, the Bank for International Settlements said early this year that the amount of dollar-denominated, non-bank debt issued outside the U.S. stands at $9 trillion (!), much of which will need repaying, or need to be rolled over, in coming years. As U.S. rates go up, it would be more expensive to borrow dollars. Hence the panicky IMF and World Bank. As well, there has been a dozen of rate cuts this year alone, including this week by the Reserve Bank of New Zealand.
Further complicating matters for the Fed is the message coming from bond vigilantes. They are on the move. Yields have spiked everywhere in recent weeks. Here at home, bonds this week for the most part continued to follow German bunds. Thursday, they rallied, ignoring better-than-expected U.S. retail sales.
The selloff so far has been manageable. But if the Fed shifts its rate-hike-this-year-talk into higher gear, how would bonds react? And at what point the selloff becomes disorderly and begin to impact equities in general?
Non-commercials do not anticipate this, at least not yet. In five weeks, they have reduced net shorts by 80 percent. Bodes well for TLT, the iShares 20+ Year Treasury Bond Fund.
Currently net short 36.6k, down 37k.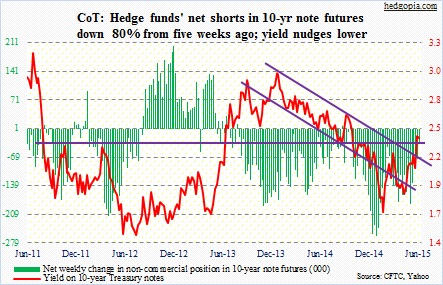
30-year bond: Next week’s economic calendar is relatively light.
Industrial production for May comes out on Monday. Since it peaked last November, there has been a loss of momentum, down five consecutive months. Ditto with capacity utilization – reached a cycle high of 79.8 percent in November, and has since dropped for five consecutive months. The last time industrial production dropped for six consecutive months was in 2008-2009.
On Tuesday, FOMC meeting begins. The same day, we get housing starts. After weak February and March, April was strong, up 20 percent to a seasonally adjusted annual rate of 1.1 million units. Month-to-month, it is a volatile series. But the recent trend has been positive. The 12-month rolling total reached a cycle high of 1.02 million units in April.
By the way, in its second quarter ended April 30, HOV badly disappointed, with deterioration in gross margins. 10-year yields have gone up 44 basis points since end-April. This has to be a housing headwind. In the short-term, though, this has the potential to jolt on-the-sidelines buyers into action.
Wednesday, the FOMC concludes its meeting. A press conference is scheduled for Chair Janet Yellen post-meeting. She will probably continue to say a rate hike is possible later this year, which is what the Fed has been telegraphing for a while now. Since they last met, Treasury bond yields have rallied strongly – yet another data point for them to now consider before they move.
The consumer price index for May is on Thursday. Recent readings have been subdued. April was up 0.1 percent m/m, with core rising 0.3 percent. In the last six months, the headline reading has been split – three down, three up – while core has been up all six months, although fractionally.
Also Thursday, the current account for the first quarter is released. This series has seen a steady improvement over the years. As a percent of nominal GDP, current account balance stood as high as north of minus six percent in 2005-2006, which now has decreased to the minus two-percent range.
The week is light insofar as speeches from Fed officials are concerned. Besides Ms. Yellen’s press conference, only two others are on schedule, both on Friday.
Currently net long 23.5k, up 17,2k.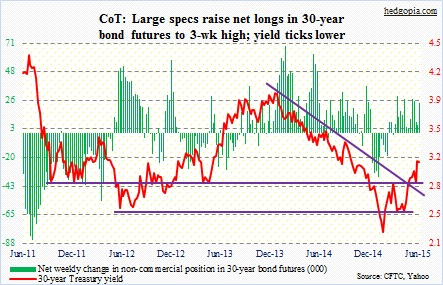
Crude oil: For the 11th session since May, the spot West Texas Intermediate crude has been rejected at 61-62. It also found support at 58 twice this week. The range-bound action continues. It has been six weeks of sideways move.
Oil bulls were unable to cash in on the inventory data. For the week of June 5, crude oil inventories declined 6.8 million barrels (courtesy of the EIA); this was much better than the expected drop of 1.5 million barrels. Crude oil peaked at 490.9 million barrels in the April 24 week – the highest in 80 years – and has since dropped to 470.6 million barrels. Further, the number of active U.S. rigs fell by seven in the latest week to 635, versus 1,542 a year ago. Both this news was positive, but unable to propel the crude higher.
The 61-62 level has now become increasingly important. The WTI can explode if bulls can stage a breakout. Nonetheless, bulls’ inability to do so on the back of inventory data this week is less of a confidence-booster. The path of least resistance remains down. Weekly conditions are way overbought. And crude oil production continues to chug along. In the week to June 5, it stood at 9.61 million barrels a day; one year ago, it was 8.46 million barrels a day.
Non-commercials for the most part continue to remain optimistic.
Currently net long 355.7k, down 18.7k.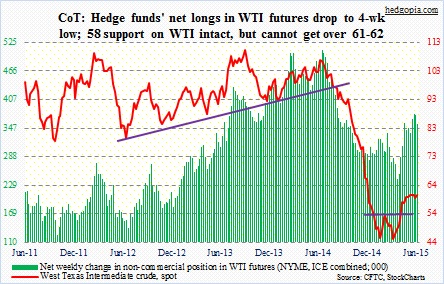
E-mini S&P 500: The verdict is in. MSCI wouldn’t add Chinese A-Shares to emerging market indexes. Estimates suggest that about $1.7 trillion in assets track the MSCI Emerging Markets Index. Last week, Vanguard Group, which partners with FTSE Russell, said it will start including A-Shares into its $70-billion emerging markets fund starting at year-end. These decisions directly impact how emerging-market portfolio managers allocate funds, not so much the S&P 500.
For the week, the SPX essentially treaded water. Bespoke tweeted out Thursday that the S&P 500 is back above its 50-day moving average but just 46 percent of index members can say the same. In other words, under the surface there is deterioration. Probably the reason why shorts are getting active.
On SPY, the SPDR S&P 500 ETF, short interest rose to 301.8 million by end-May. As early as two months ago, this stood at 234.7 million. If bulls had their way, they would have liked to use this as a tool to squeeze the shorts. However, as things stand now, their own complacency can come in the way. The 21-day CBOE put-to-call ratio stood at 0.605 Thursday (rose to 0.611 on Friday). In the middle of September, right before the S&P 500 went on to correct nearly 10 percent, it was 0.59. The ratio again dropped to that level late November, and the S&P 500 pulled back five percent.
Non-commercials probably are looking at a similar scenario. Their net shorts jumped to a 12-week high.
Currently net short 92.8k, up 68k.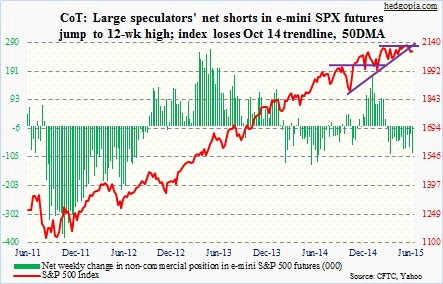
Euro: The week produced a lot to chew on across the pond. Major European bourses essentially went sideways. The 10-year German bund rallied to yield north of one percent during the week – the first time since September. The IMF walked out of Greece bailout talks, citing a lack of progress. Jens Weidmann, Bundesbank president, warned that the risk of insolvency is increasing by the day. These two were probably channeling bad cops. Playing the good cop, the ECB lifted its emergency funds ceiling for Greek banks to €83 billion from €80.7 billion.
In the end, despite this vacillating message, the euro kept most of its gains, probably suggesting that a Greek solution is in the price. Shorts are cutting back. As of end-May, short interest on FXE, the Currency Shares Euro Trust ETF, dropped 8.5 percent in the reporting period, and has declined 38 percent since mid-March.
Non-commercials are cutting back as well, with net shorts down 39 percent in the last 10 weeks.
Currently net short 138k, down 27.5k.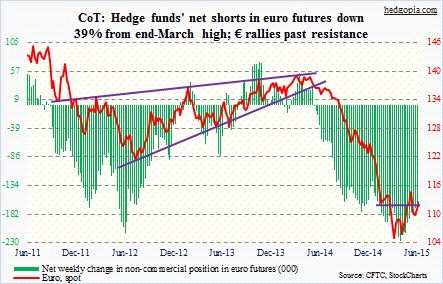
Gold: The metal faced resistance where it was expected to. Last week, it fell under 1,180, and this week an attempt to push through that level failed, even though it was an up week. It is literally sitting on that price point.
One of the reasons gold has been under pressure of late is the sheer explosion in short interest in GLD, the SPDR Gold Trust Shares ETF. In the May 15-29 period, short interest surged 81 percent, to 18.4 million. The metal fell 2.7 percent during the period. This can also be a source of short squeeze if gold bugs can get their act together.
Nonetheless, non-commercials cut back big.
Currently net long 75.1k, down 29.3k.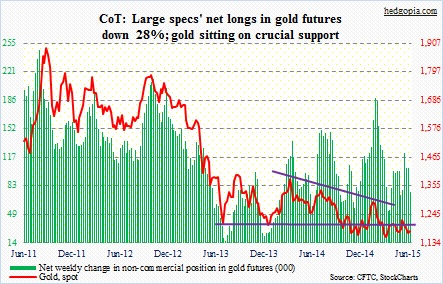
Nasdaq 100 index (mini): As goes AAPL so goes the Nasdaq 100. The stock makes up nearly 15 percent of the index. In February-May, AAPL got rejected at $133 three times, with the latest failure toward the end of May. The stock quickly lost seven points from that point. Weekly momentum indicators look to be itching to go lower. This also holds true with the NDX, which has lost 4480, although ever so slightly, and could be on the verge of losing the October 2014 trendline.
Shorts are yet to press their case. Short interest on QQQ, the PowerShares QQQ Trust ETF, has been in the low 40 million the past five periods; at the end of October last year, it stood at 78.7 million, which proved to be a squeeze tailwind.
Currently net long 47.7k, down 20.6k.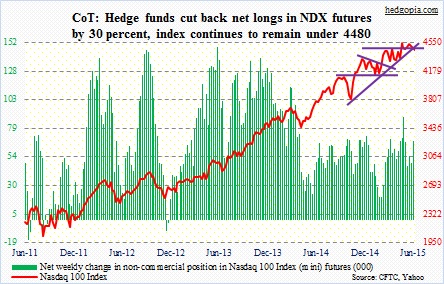
Russell 2000 mini-index: The relative outperformance continues – the Russell 2000 versus the S&P 500. The former has been leading since early May. It is tempting to argue that money is rotating out of utilities as well as consumer staples and into small-caps, but that may be a stretch. But there is no question the Russell 2000 attracts bids – for whatever reason. Intermediate-term, RUT is a short.
RVX, the Russell 2000 Volatility Index, not being able to take out 18 has helped the Russell 2000. And short interest on IWM, the Russell 2000 iShares ETF, has gone up a tad – from 97.3 million two months ago to 116.7 million now, but nothing major. At the end of July last year, it stood at 172.5 million.
Non-commercials have reduced net shorts by 38 percent in the past two weeks.
Currently net short 20.1k, down 9.4k.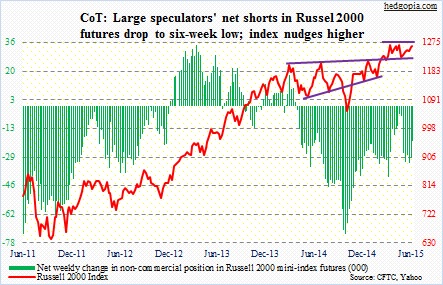
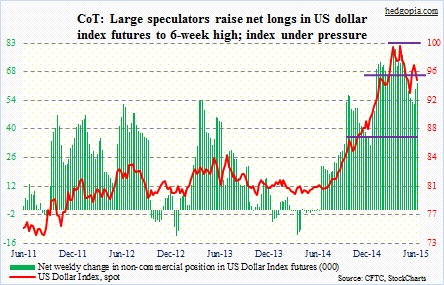
U.S. Dollar Index: One would think higher interest rates would act as a tailwind, but that was not to be early in the week. In the first three days, the index dropped 1.8 percent, even as the 10-year Treasury yield was higher by eight basis points. This also took place last week – the 10-year spiked 31 basis points but the index lost 0.6 percent. As this is going on, the 50-day moving average is gradually beginning to point down.
Non-commercials have used the recent weakness to add to net longs, to a six-week high.
Currently net long 62.9k, up 3.1k.
VIX: Will it ever? Seriously. Volatility bulls must be gnashing their teeth at the inability of spot VIX to push through 15. The count is now 12. That is the number of days in the past couple of months VIX tried but failed to take out that resistance. The longer it gets hammered from underneath, the higher the odds it will crack. Eventually. Spring is coiled.
If non-commercials are right, it will be a while before that happens. Net shorts are near one-year highs.
Currently net short 74.4k, up 4.1k.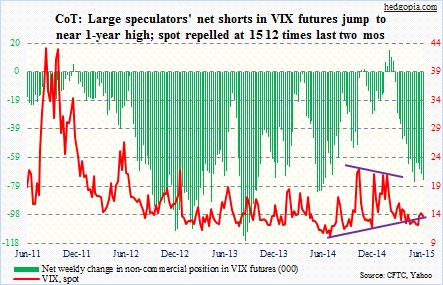
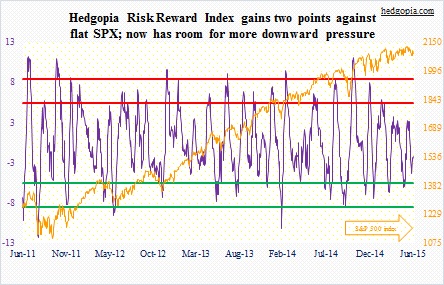
Hedgopia Risk Reward Index