The following are futures positions of non-commercials as of June 30, 2015. Change is week-over-week.
10-year note: Non-commercials continue to reduce net shorts – currently lowest since September 23rd last year. They have reduced net shorts by 98 percent in the last eight weeks. Of late, the 10-year yield has shown healthy action, with breakouts to boot. This is what could be prompting non-commercial action.
In the near- to medium-term, the intra-day high of 2.49 percent five sessions ago could prove to be important. This resistance goes back a couple of years. On a weekly chart, conditions are way overbought. The tailwind provided by non-commercials’ reduction in 10-year-note futures is no more. So yields could very well be at an inflection point.
The June jobs report obviously was no help. Non-farm payroll only added 223,000 jobs – below expectations. Plus, both May and April were revised lower. Wages continue to be stagnant. Prior to the jobs report, Fed futures were pricing in a 17 percent likelihood of a hike in Fed funds in September. After the report, this dropped to 10 percent.
What next? Non-commercials switching to net longs? Fingers crossed!
Currently net short 3.5k, down 43.2k.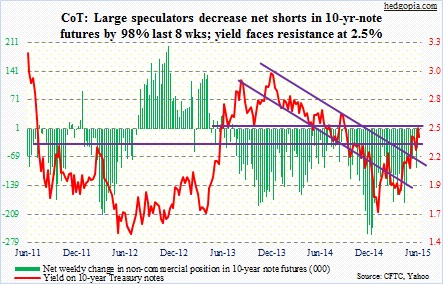
30-year bond: Non-commercials are now net short – for the first time in 17 weeks. As is the case with 10-year yields, the 30-year too faces resistance – 3.25 percent in the latter’s case.
Next week’s major economic releases, which could potentially impact how bonds are traded, are as follows.
The ISM Non-Manufacturing Index is on Monday. In May, it dropped 2.3 points to 55.7, but held up better than its manufacturing cousin. Services make up more than two thirds of the economy. In June, the Manufacturing Index rose from 52.8 to 53.5. As well, manufacturing orders rose ever so slightly – from 55.8 to 56.
On the back of less-than-forecast June non-farm numbers, the JOLTS report, due out Tuesday, for May probably takes on added importance. Job openings – 5.38 million – were at a new high in April, even as quits peaked in January, which is when the quits-to-hires ratio peaked at 0.56; April was 0.53. So not all the wheels of JOLTS are moving in sync. Given non-farm payroll was weak in June, with both April and May having been revised lower, it will be interesting to see if job openings face downward revision as well.
FOMC minutes for the mid-June meeting are published on Wednesday. When they met, May produced a rather strong 280,000 non-farm jobs, which has now been revised lower to 254,000.
Six Fed officials are on schedule to speak, including Chair Janet Yellen.
Currently net short 4.1k, down 18.7k.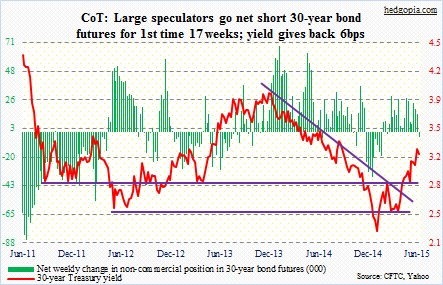
Crude oil: For the week of Jun 26, U.S. crude oil inventory rose 2.4 million barrels, to 465.4 million barrels, breaking a recent trend of decline in inventory. Inventory peaked at 490.9 million barrels in the April 24 week.
In recent weeks, spot West Texas Intermediate crude had been unable to rally on persistent decline in inventory. It almost felt like those who wanted to go long already did so, even as sellers were on strike. This was resolved last week, as the WTI dropped out of the range it has been in for nearly three months now.
Since May, the WTI had been rejected at 61-62 13 times. At the same time, 58 consistently provided support. On Wednesday, it fell two-plus percent to lose that support, which then went on to resist a rally attempt on Thursday. In the process, the crude lost its 50-day moving average.
With this, major support at 54 is probably in play. In the medium-term, momentum is weakening, and there are tons of weekly overbought conditions left to be unwound.
Non-commercials have been cutting back since the high six weeks ago, but holdings remain sizable.
Currently net long 338.4k, down 9.5k.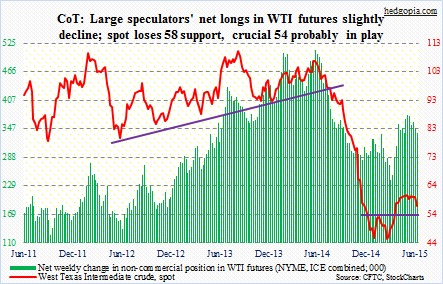
E-mini S&P 500: Last Monday, the S&P 500 dropped two-plus percent. By Tuesday, non-commercials were smelling blood. That is how it looked looking at how aggressive they had gotten with their bearish bias, raising net shorts to the highest since June 2012.
This has come after the index, having already lost its mid-October 2014 trendline, has now suffered a false breakout. The Monday drop put the index right on its 200-day moving average; this would be the first test since early February.
Daily momentum indicators are overbought. There is support at 200 DMA. The earnings season begins this week, where the bar is low. This is as good an opportunity as any for bulls to step up to the plate. Weekly indicators, however, have room to go lower still – a medium-term concern.
Currently net short 134.1k, up 41.9k.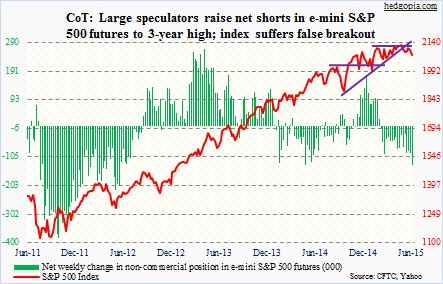
Euro: Despite the Greece uncertainty, the currency rallied strongly on Monday. Was it because buyers thought a ‘no’ vote in Greece, possibly followed by Greece exit from the eurozone, would make the euro eventually stronger? While possible in a larger scheme of things, further turmoil in Greece probably gives the ECB a solid excuse to run its printing press overtime – a development, if comes to pass, likely is not euro-friendly.
In the end, the currency ended down 0.5 percent for the week. It has dropped back below its 50-day moving average. Near-term, euro bulls have oversold daily conditions on their side, while bears would like the currency to begin to unwind overbought weekly conditions. A bull-bear battle is at hand this week.
Currently net short 100k, up 729.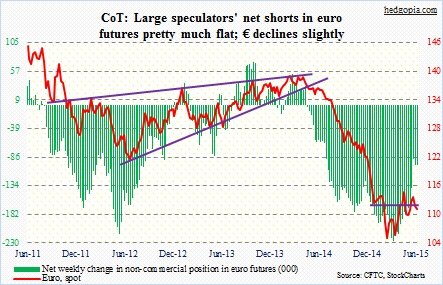
Gold: Since the end of January, non-commercials have cut back net longs by 64 percent. A week prior to that, the spot gold peaked at $1,307.80 per ounce. They continue to lighten up, having reduced holdings by 29 percent in the latest week, to a 14-week low.
It is counter-intuitive, but developments in Greece have not helped gold at all. The yellow metal fell last week. It can partly be explained by widespread investor belief that the ECB would not let an Armageddon scenario come to pass in the eurozone. This view is probably shared by non-commercials, going by their holdings.
Near-term, gold is oversold on a daily basis, and is sitting right on its lower Bollinger Band. On the other hand, daily moving averages – on every time frame – are pointing lower, and is below 1,180 support.
Currently net long 67.2k, down 28k.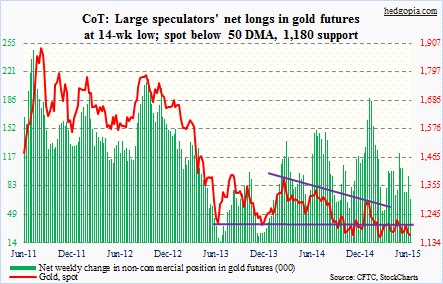
Nasdaq 100 index (mini): It has been several weeks since several major indices, including the S&P 500 and Russell 2000, lost the mid-October 2014 trendline. Last week, the Nasdaq 100 joined that group. In a space of two months, the 4550 level repelled rally attempts three times. The index also lost support at 4480, although not by much.
This probably affected non-commercials’ decision to cut back on net longs, which were reduced to a 20-week low.
Support-turned-resistance at 4480 also approximates the 50-day moving average, which is destined to be a major battle zone between bulls and bears should the index attempt to rally.
Currently net long 30.9k, down 43.8k.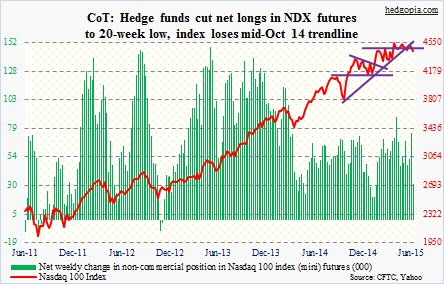
Russell 2000 mini-index: A week ago, for the first time in 15 months, non-commercials went net long. They were probably emboldened by the breakout two weeks ago. If it held, that would be a major development. Bulls, however, were not been able to hold on to it. It paid off to be cautious.
The 2.6-percent drop on Monday had the index slice through its 50-day moving average, and is currently trying to stabilize around its 100-day moving average. On a daily basis, the index is beginning to look overbought, but weekly indicators have a ways to go before overbought conditions get unwound.
RVX, the Russell 2000 Volatility Index, rallied 23 percent last week – past resistance at 18-19. It is way overbought in the near-term, and volatility bulls need to save that support for the Russell 2000 to come under further pressure.
Major support lies at 1210, which is three percent away.
Currently net long 5.6k, down 4.5k.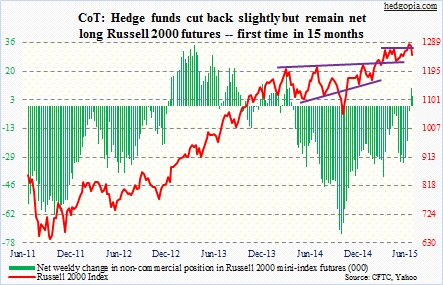
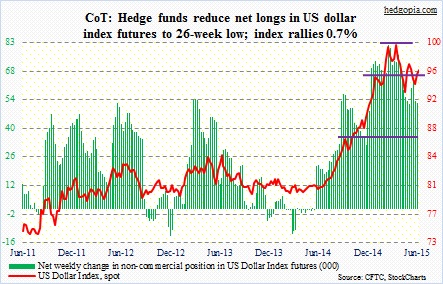
U.S. Dollar Index: Non-commercials reduced net longs to a 26-week low. Off the mid-April highs, net longs are now down 33 percent. The euro makes up 57.6 percent of the index, so the fate awaiting the former is bound to have immense impact on the dollar. Medium-term, the euro’s probable path of least resistance is down.
Plus, manufacturing PMI in emerging Asia is yet to rebound. In China, June remained unchanged at 50.2. In Korea, it fell to 46.1 – the lowest since September 2012. And in Taiwan, it fell to 46.3 – a 33-month low. These are negative developments for local currencies.
Currently net long 51.4k, down 949.
VIX: Since April, VIX’s rally attempts consistently stopped at/near 15. The 17-18 level has acted as support/resistance going back two decades. And, for two and a half years now, it spiked to 21-22, before quickly reversing. All that ended last week, as the so-called fear index surged 20 percent. As a matter of fact, by Tuesday it was up 41 percent intra-day, before it gave back those gains.
Several times in the past, VIX has shown a tendency to spike, only to quickly reverse. And that has been a good time to own equities for a trade as VIX unwinds its overbought conditions. Thursday, it closed three points off the weekly highs. To give volatility bulls credit, they defended support at 15, which also approximates the 200-day moving average.
This week is crucial – which could potentially decide if last week’s surge was the beginning of a trend or a signal to own equities near-term.
As far as non-commercials are concerned, they continued to cut back on net shorts, having reduced their holdings by 53 percent in the past three weeks.
Currently net short 34.8k, down 17.5k.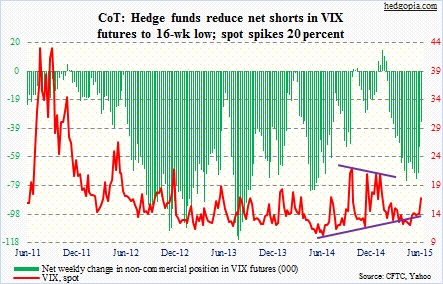
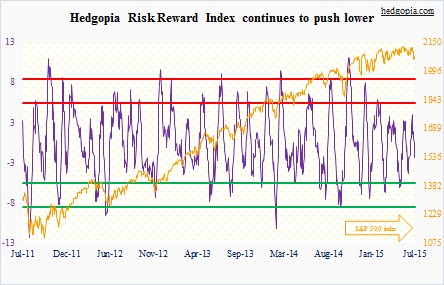
Hedgopia Risk Reward Index