The following are futures positions of non-commercials as of February 24 (Tuesday). Change is week-over-week.
10-year note: Non-commercials are doing it again. They increased net shorts by 63 percent in the latest reporting period. Turns out they picked a wrong week. Ten-year notes went up. From the intermediate-term perspective, most indicators are smack in the middle. So next week will be crucial. And it is a data-heavy week – from ISM manufacturing and non-manufacturing to construction spending to employment. Reminder: The Chicago PMI came in at 45.8, indicating manufacturing contracted in the Midwest in February! In the midst of all this, the 10-year yield is sitting on the lower end of the channel it is in. This week, it did not even try to test that straight-line resistance (chart). The case for the yield probably heading lower is looking strong. Currently net short 109.7k, up 42.5k w/w.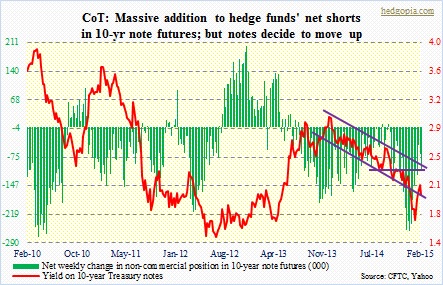
30-year bond: These traders added to their net longs. Just a little bit. The thing is, they have stayed put with their positions. This is the second consecutive week they are net long after nine straight weeks of staying net short. And they were rewarded in the latest period. Just a tad. TLT was up 0.8 percent for the week. During the week, 2.55 percent was successfully tested on Thursday (the chart does not show it, as it uses weekly closing price). This may not be the last time that support gets tested. Currently net long 8.7k, up 0.205k.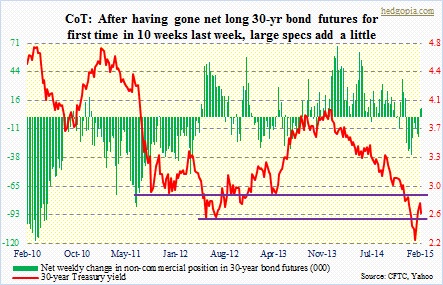
Crude oil: The WTI does not stand a chance until it clears two-and-a-half-month resistance at $53.50-$54. In the prior week, there were several attempts. This week, sellers showed up earlier, around $51. The good thing is, crude has not fallen apart despite the fact that both inventory and production have continued to make new highs. The not-so-good news is that lots of buying power was expended during the four-day, 24-percent move early this month. As things stand now, the only hope it has is if the dollar rolls over. Otherwise, it may just decide to grind lower. Non-commercials did cut back a little, but remain heavily net long. Currently net long 308.1k, down 28.1k.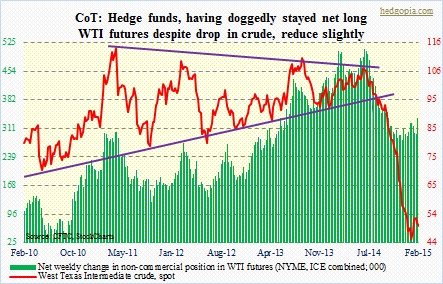
E-mini S&P 500: Oh, boy! They took a hatchet to their net longs, reducing to a 13-week low. Net longs were reduced 74 percent in the period, and have gone from 171k to 24k in seven weeks. This is particularly interesting in that the massive reduction comes in the week after the S&P 500 large cap index staged a breakout. The index is still above 2080-2100. But the way things are looking now, it would not be long before that support gets taken out. Short-term averages are hooking down, and daily indicators have already rolled over. Intermediate-term indicators still look fine, but should begin to weaken if there is pressure in the near-term, which is looking probable. The caution flag is out.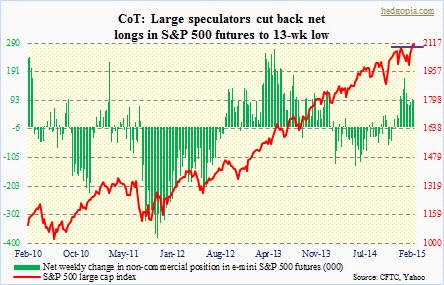
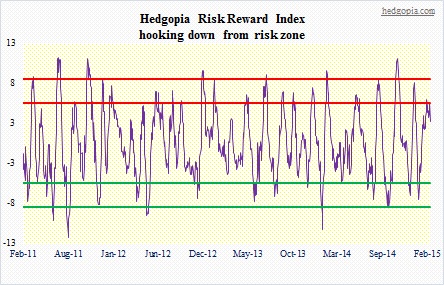
Our own Hedgopia Risk Reward Index seems to have started its journey down from the risk zone, and has a ways to go before it gets to the reward territory (chart at the end). Currently net long 24.2k, down 68.8k.
Euro: It cannot catch a break. After what looked like a healthy five-week sideways action came two bad sessions (Thursday and Friday), and the currency was back to literally hanging by a thread. In the chart, FXE, the euro ETF, is used, and it already cut the January lows. But the euro has not. So from that perspective, the currency has gone sideways the past five weeks. Oversold, yes, but if there are no bidders, it does not matter. Non-commercials cut back slightly, but continue to hold massive net shorts. In a worse-case scenario, there is always 107 – the ETF’s low in September 2003. As well, a trendline drawn from December 2004 extends to 107. Currently net short 177.7k, down 7.8k.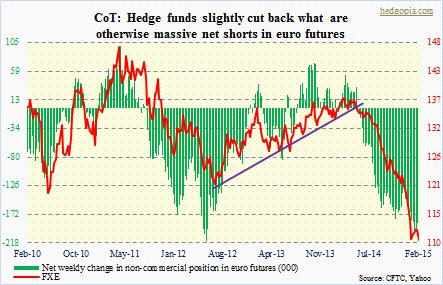
Gold: 1,200 on spot gold was defended, both Monday and Tuesday. If near-term indicators hold sway, there is room for the metal to go higher. Not so from the intermediate point of view. The problem is, even if it manages to rally here, sellers will appear at 1,230-1,250. That support in the chart is a must-hold. The more it gets tested, odds are the weaker it gets. Hopefully for gold bugs, non-commercials are not losing patience (for the metal to break out of that triangle). They still hold sizable net longs, but have been cutting back. They held 189k as early as four weeks ago. Currently net long 126.2k, down 5.5k.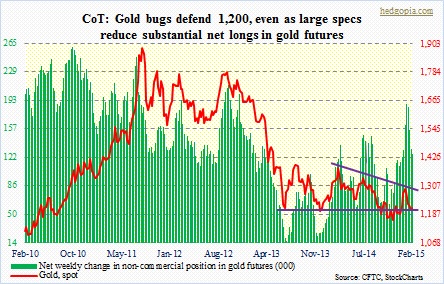
Nasdaq 100 index (mini): These traders continued to add to their net longs. The momentum crowd is in tech currently. Year-to-date, the S&P 500 is up 2.2 percent, and the Nasdaq 100 up 4.8 percent. AAPL, with the largest weighting in the latter, is up 17 percent. The stock’s performance has been a boon, but can be a curse as well. When it reverses, its sheer weight will pull the whole thing down, the same way it held things up the past couple of months. It is beginning to show some cracks. Shorter-term moving averages are rolling over. Nothing wrong with the stock. But it is just tired. Plain and simple. It has had such a big move in such a short period of time. Needs a breather, and that is bound to adversely impact the index. Currently net long 54.4k, up 4.3k.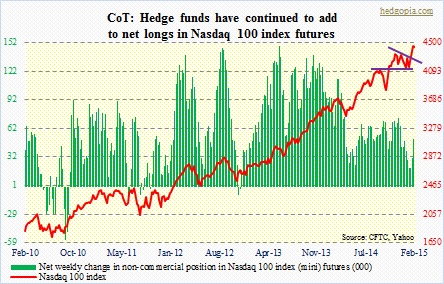
Russell 2000 mini-index: The index has not been able to build on the recent breakout. Last week, it managed to just about take a peek out of the wedge it is in. This week, it went sideways. In the big scheme of things, this is not so bad. However, increasingly it feels like small-cap bulls expended lots of energy bringing the index this far, hence are running out of buying prowess. This is probably why these traders are staying put with their bearish bias. They will be rewarded. Currently net short 30.1k, up 1.1k.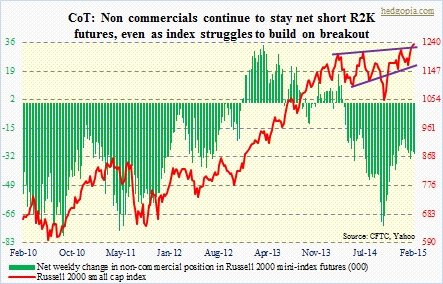
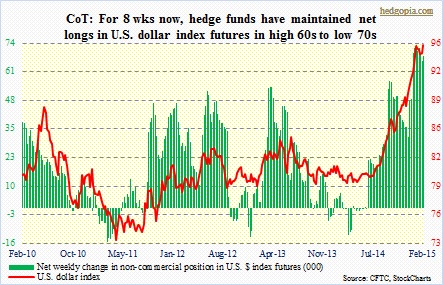
U.S. Dollar Index: It now finds itself in a five-week-long, two-point range. A break out of here has the potential to light another fire underneath the buck – however insane that sounds. Bulls continue to latch onto the positive and ignore the negative. After Chair Janet Yellen sounded dovish (Tuesday and Wednesday), the currency came under pressure a little. They then latched onto Thursday’s CPI report, which showed a 0.2 percent rise in core inflation in January. The implication being this would force the Fed to hike sooner – which increasingly looks improbable, but the dollar crowd thinks that way. Despite this, these traders are not adding to their net longs, though they are sitting on what they have. Unwinding will be painful, whenever that is. Currently net long 68.2k, up 2.1k.
VIX: After five straight weeks of staying net long, they have now gone net short. Time to play a contrarian, perhaps. At least since the current bull market began, these traders going net long VIX futures meant time to go long stocks. Worked this time, too (shown by the orange ovals and corresponding blue arrows in the chart). Now that they have gone net short, the VIX is beginning to act like it does not want to go much lower. Intermediate-term, it still can come under pressure a little bit. But here is the thing. The VIX, which measures implied volatility of SPX options one month out, is way cheaper than the VXV, which measures three-month volatility. The ratio between the two on Friday was 0.78. This is a very low reading, and in the past has been associated with an increase in demand for short-term protection and the resulting selloff in stocks. Currently net short 6.9k, down 14.3k.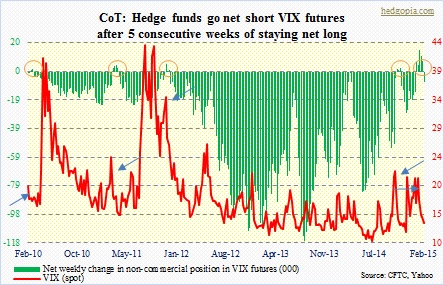
Hedgopia Risk Reward Index
This was discussed on the 19th. It is meant to measure where we are from the viewpoint of risk and reward. Signal is meant to last for weeks, not months. Back then it was in the risk zone. Once the journey from the red to the green begins, stocks come under pressure. If not already, we are probably in the process of entering that phase. That is the message it is sending us.