The following are futures positions of non-commercials as of March 31, 2015. Change is week-over-week.
10-year note: At some point, the streak had to end. For 12 months to February, U.S. non-farm payroll grew 200k-plus month-over-month. Consensus was for that to continue in March. That was not to be. Only 126k were added in the month. The question is, is this one-off or beginning of a trend? Are adverse energy and dollar dynamics finally catching up with employment?
For a while now, U.S. macro data has been in a dichotomy. Production numbers have disappointed, while employment has been a consistent bright spot. March’s ISM manufacturing was the latest example. The index has now slowed for five consecutive months (51.5, from 57.9 in October). New orders and inventories almost reached parity in the month – 51.8 and 51.5, respectively; as early as December, orders exceeded inventories by 12.3 points. That is serious deceleration.
So even those who have been blaming every bad economic data on weather will probably not be as eager to brush off the March employment report as an aberration. Talking of weather, existing home sales nudged up 1.2 percent in February, new-home sales surged 7.8 percent; the former was blamed on weather, the latter not. Go figure!
In this environment, it is not a surprise that bonds continue to attract money. For the week, the 10-year yield fell another 11 basis points. These traders mistimed it, though, as they cut back. The 10-year currently sits right at the bottom end of a one-and-a-half-year downtrend channel.
Currently net short 113.8k, down 66k.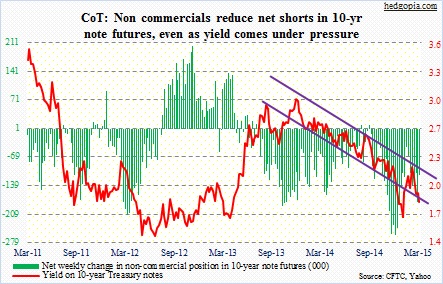
30-year bond: They added to their net longs during the reporting period, and that paid off a tad, since the yield took a dive post-March employment numbers.
The jobs report probably puts the final nail in the coffin of those expecting a rate hike in June. Year-over-year growth in hourly earnings for production and non-supervisory employees has continued to stay under two percent. The 1.8-percent growth is much worse than the 2.1-percent growth for all employees. Much of the wage growth is going to the supervisors, not the supervised; the latter makes up 80 percent.
FOMC minutes are due on Wednesday, and are less likely to contain any nuggets, except to cite data dependency. The latest trend in economic data is anything but looking up. Among various other reports in the calendar next week, the one to pay attention to includes the JOTLS survey (Tuesday). This series only goes back to 2004, but is useful. ‘Job openings’ has tended to lead non-farm payroll; January was an all-time high, at five million. However, mining-and-logging job openings have dropped from 35k in October to 13k in January.
Once again, is pain in the energy sector beginning to filter through to the economy?
Currently net long 17.2k, up 4.9k.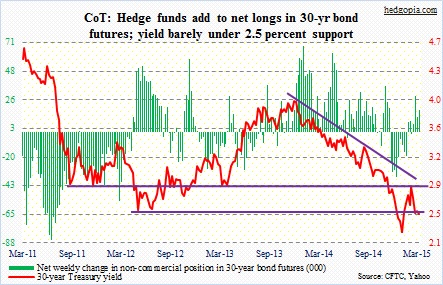
Crude oil: Domestic crude output fell by 36,000 barrels in the week ended March 27 to 9.4 million barrels. This was the first weekly decline since the end of January, although production remains near decade-highs. This is precisely what the three-month-long sideways action in spot WTI has been hoping to see. But probably not the latest developments out of Iran. Assuming that nation is allowed to bring additional oil to the market in June, that is one more destabilizing factor in the supply/demand dynamics. Even though this is not a concern for another three months; in a rather perverse way, it is possible this will be viewed as positive – relatively, that is. The line in the sand continues to be $53-$54. One tidbit: fracking accounted for 49 percent of U.S. oil production in February and 54 percent of natural gas production (courtesy of WSJ).
Currently net long 251.5k, up 10.4k.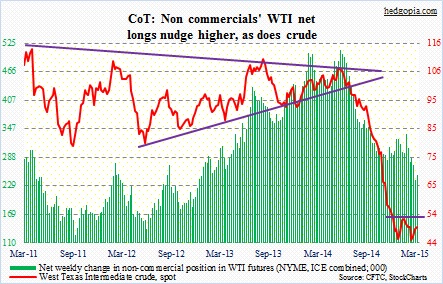
E-mini S&P 500: On a monthly chart in March, the S&P 500 large cap index now has a MACD crossover. This does not happen very often. More important, this has developed even as sentiment is profusely bullish, with the 10-week moving average of Investors Intelligence’s bearish reading at 14.7 and the National Association of Active Investment Managers’ exposure index at 84. This raises a caution flag in the medium- to long-term.
Short-term, the S&P 500 index failed to make a new high nine sessions ago.
In June last year, 2015 operating-earnings estimates for S&P 500 companies were $137.52. Now, they are $118.55; they were $131 as early as three months ago. With the economy in deceleration – at least going by 1Q – and the earnings picture deteriorating fast, there is nervousness in the air.
On Wednesday, there was a sharp drop overnight in S&P 500 futures, all the way down to 2030s, before recovering. The selling pressure came out of nowhere.
But the fact that bids showed up around support (2040 is a must-hold) indicates that there is still willingness to go long this market. Particularly so because the 1Q earnings bar is low. In the options market, the 21-day moving average of both CBOE put-to-call ratio (equity) and ISEE index (equity) is approaching levels that in the past have flagged decent short-term bottom for stocks.
We will see if that pans out. We should get the first signs of that on Monday – whether or not the jobs report-induced sell-off will draw buyers in.
In fact, these traders seem to be anticipating that, having cut back net shorts 63 percent the past couple of weeks.
Currently net short 35k, down 9k.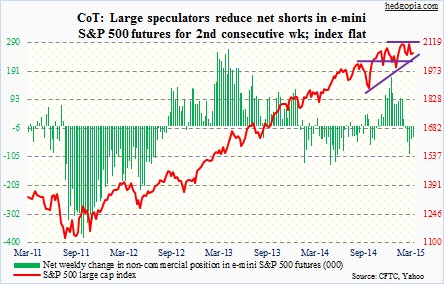
Euro: Yet another high in net shorts – second consecutive record week! In the chart below, FXE price is as of Thursday. The euro rallied on Friday in the wake of the jobs report. So even though these traders have done an excellent job of riding the euro downtrend since the middle of last year, the past three weeks have been a little different. FXE dropped all the way to 102.92 and has risen four percent since; it managed to rise to 108.10 last week. Resistance continues to be at 110. Maybe that is why non-commercials continue to add to net shorts, considering it will not be easy to climb over that hurdle, at least at the first try.
Currently net short 226.6k, up 5.6k.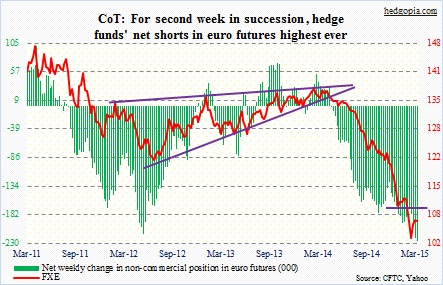
Gold: After having cut back net longs for seven consecutive weeks, they added some last week. This week, they continued to add. And it was a decent size. Right around where spot gold is trading, several moving averages have converged, including 50- and 100-day. For a while now, the metal has gone on a sideways journey – kind of a base-building action. Gold bugs definitely hope so. They should like the fact that the 1,180 level has continued to generate buying interest, including Tuesday.
Currently net long 80k, up 25.7k.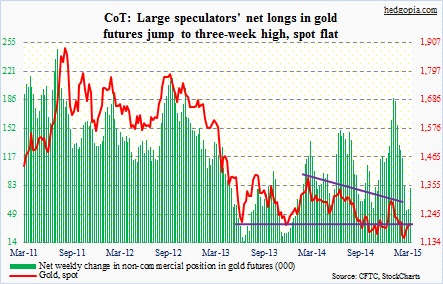
Nasdaq 100 index (mini): On QQQ, the 104-and-change level, which also corresponds with its 100DMA, was tested again this week. There was a successful test last week, and that rally attempt was scuttled at short-term moving averages, which are now sloping down. Bulls cannot afford to lose this price.
From AAPL to MSFT to INTC to GOOG, large-cap techs are not showing encouraging price action. IBB, the biotech ETF, has not been able to rally strong off of its 50DMA. Medium-term, it is just a matter of time before it loses that support. The only question is what might be in store short-term.
Once again, reaction to Monday’s early weakness will be a good tell.
Currently net long 52.3k, down 8.5k.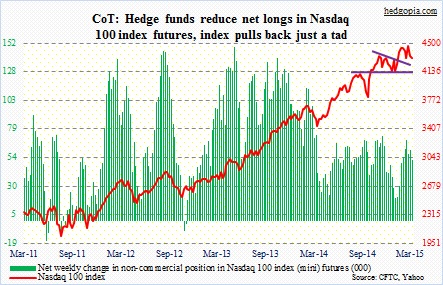
Russell 2000 mini-index: Small-caps continue to confound common sense. In normal circumstances, because they tend to be domestically focused, signs of deceleration in economic activity bring bad news for these stocks. Nonetheless, money is gravitating toward them. For the weeks ended March 31, IWM had inflows of more than $1 billion, while more than $8 billion flowed out of SPY (courtesy of ETF.com). Small-caps only account for less than 10 percent of the U.S. stock market. Nonetheless, if they can rally here, that can help ignite risk-on attitude. This week, RVX, the Russell 200 volatility index, was once again rejected at its 200DMA, and is likely headed lower near-term.
Currently net short 16.8k, up 3.6k.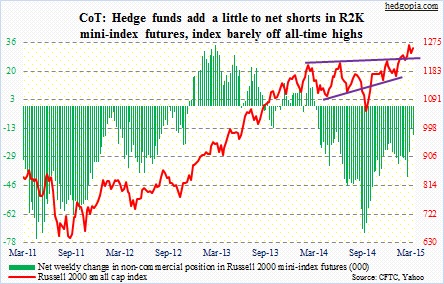
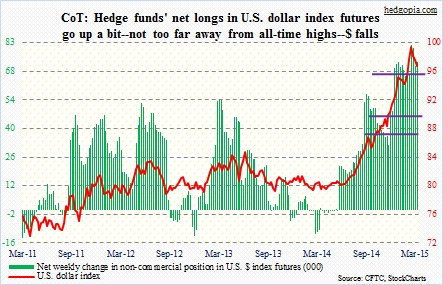
U.S. Dollar Index: Is the surging dollar finally beginning to impact U.S. exports? ISM manufacturing’s new exports orders index has dropped from 55 in November to 47.5 in March. Exports of goods and services have dropped from $198.7 billion in October to $186.2 billion in February.
In March, health care was the only major sector that managed to rise, and it is probably the least exposed to FX dynamics as well as interest rates. If you need a drug, you need a drug. There is no avoiding it. (By the way, XLV saw massive distribution in the month.)
Another currency-induced development was witnessed in the ETF land. In 1Q, currency-hedged ETFs accounted for more than one-third of the nearly $59 billion that flowed into ETFs.
Near-term, the 96 level on the U.S. dollar index should continue to act as a magnet, where horizontal support converges with 50DMA.
Currently net long 73.1k, up 1.9k.
VIX: Spot continues to hug its 200DMA. As low as it is, it is hard to imagine it going any lower. But that is exactly the outcome these traders have their money on. As far as VIX bulls are concerned, the good thing is that the nine-month trendline support has held so far. Another test may very well be around the corner.
Currently net short 44.3k, down 1.8k.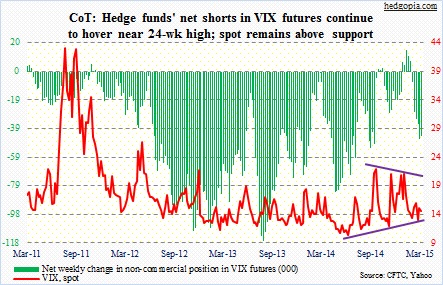
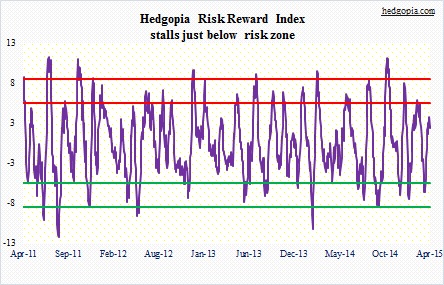
Hedgopia Risk Reward Index