The following are futures positions of non-commercials as of April 21, 2015. Change is week-over-week.
10-year note: Are bond vigilantes expecting a hawkish tone from the FOMC next week? The latter meets on 28-29. For the most part, macro data this week was weaker than expected. The 10-year yield went on to tack on seven basis points.
Last Friday, it kissed the bottom end of its Bollinger Band, followed by a turn higher in daily momentum. The subsequent move got cut short on Thursday at the 50-day moving average (at two percent), which has provided resistance all this month. TLT is sitting right on 129, and needs to push through for rates to move lower near-term, which likely happens.
Earlier on Monday, William Dudley, president of the New York Fed, said in a speech: “Most of the impact from the decline in energy prices that has weighed down overall inflation is likely over.” He was obviously implying that inflation was about to rebound.
At least some investors are beginning to buy into this thesis. Last week, TIP attracted $634 million – biggest inflow since its inception in 2003 (courtesy of Bloomberg). These people are betting that inflation is percolating.
Non-commercials seem ready for a hawkish FOMC message. Watch out if it does not oblige.
Currently net short 153.4k, up 41.5k.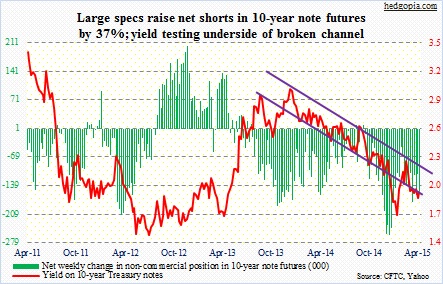
30-year bond: Next week’s economic calendar is heavy. Besides the FOMC meeting, construction spending, and three consumer sentiment surveys, the first estimate of 1Q GDP will be printed on Wednesday. The consensus expects growth of 1.4 percent (real). The Atlanta Fed’s GDPNow forecast is not as sanguine; as of April 16, its estimate was a mere 0.1 percent. We will find out who has the right model!
Thursday is personal income for March. In February, core PCE deflator increased 1.4 percent year-over-year. This is the Fed’s favorite inflation measure. The last time core PCE increased at two percent was in April 2012. The Fed has made it clear it prefers two percent inflation. So this series has the potential to impact trading – from the dollar to interest rates, and by default equities, and what not.
Also Thursday is the employment cost index for 1Q. This series includes both wages and benefits, hence its growth rate is a little bit chirpier compared to the average hourly earnings in the monthly employment report. In 4Q, total comp grew 2.3 percent year-over-year (wages & salaries 2.3 percent and benefits 2.6 percent). Any acceleration, and it has the potential to put upward pressure on rates, and by default the dollar.
The ISM manufacturing index for April is published on Friday. At 51.5 in March, it has had five consecutive decreases since last October (57.9). Even more telling is the drop in new orders, from 63 to 51.8. This totally jives with the deterioration in non-defense capital goods ex-aircraft orders – down for seven consecutive months.
These traders reduced net longs to a seven-week low – essentially flat, ahead of a date-heavy week.
Currently net long 4.8k, down 21.7k.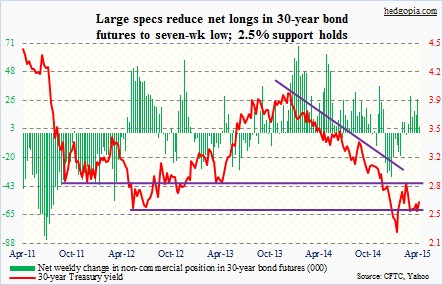
Crude oil: In four out of the last six sessions, spot WTI has produced dojis on a daily chart – probably a sign that the crude is itching for a breather. And why not? In five weeks through the intra-day high this week, it has rallied 38 percent. The mid-March uptrend line is intact, and will be broken if the price drops below 54. That is also the level the crude broke out of eight sessions ago. If it is a genuine breakout, broken resistance should turn into support. Upward-sloping (ever so slightly, though) 50DMA lies north of 50. This is another spot where, should 54 break, buyers should be willing to step up. As a reminder, .236 Fibonacci retracement of the June 2014-March 2015 decline lies at 57.81; this week’s high was 58.63.
Now on to yet another yin yang analogy.
Yang: JP Morgan expects seasonality in oil demand should increase the use of oil by nearly three million barrels per day from 1Q15 average levels by the end of the year. Yin: Bloomberg Intelligence points out that there are 4,731 wells that have been drilled but yet to be tapped, “keeping 320,000 barrels a day underground.” The implication being these drillers will complete work and start pumping once price firms up.
These traders disagree. They raised net longs to a 31-week high.
Currently net long 357.8k, up 47k.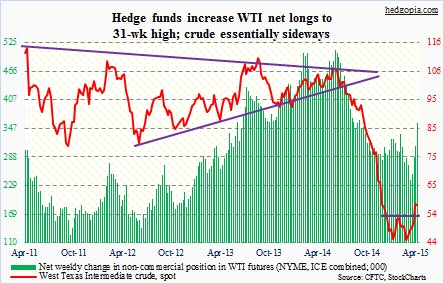
E-mini S&P 500: To say that this is a very frustrating market is an understatement. One second it looks like the bears finally have the advantage, and the very next second things would have shifted in favor of the bulls. No wonder retail is confused. AAII neutrals were in the 40s for the third consecutive week. Investors Intelligence newsletter writers, on the other hand, beg to differ; last week’s count of 13.9 percent bears was a multi-decade low (this week, it did inch up to 15.2).
The index has not been an exception to this indecision. Since late February until Wednesday, SPY touched the 211 area in eight separate sessions but was unable to convincingly close above. Hence it is only natural that this area would be a magnet for stops. Did those stops get taken out shortly before noon on Thursday? It sure looks that way looking at a five-minute chart.
The next leg higher has to come from genuine demand. The battle will be fought between those who live and die by the ‘sell in May, and go away’ maxim, and those that are staying put because the buyback window is reopening.
The S&P 500 had been trading within a wedge the past couple of months. It has broken out of that wedge, with a new intra-day high. A pure technician would be eyeing a measured target of 2180. Just looks silly, right? How about 2138, which is 1.618 Fibonacci extension of the October 2007-March 2009 decline?
These traders would not like that to happen.
Currently net short 48.2k, down 2.4k.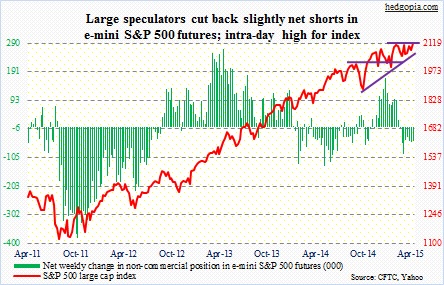
Euro: The pattern of higher lows continues, even as 50DMA continues lower. Early this month, the currency rallied up to 110.37 and was rejected by that average, which has now dropped to 109.15, which is just a stone’s throw away. On Thursday, the euro broke out of a month-and-a-half symmetrical triangle. The next hurdle is 50DMA.
These traders remain steadfast in their bearish stance.
Currently net short 214.6k, up 2.3k.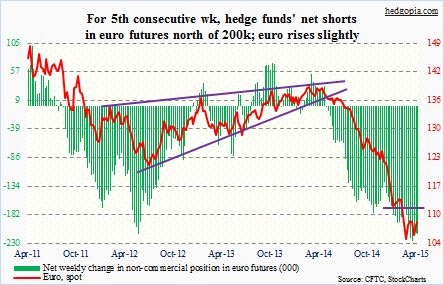
Gold: For the past 14 consecutive sessions, the metal had essentially been straddling its downward-sloping 50DMA, with no momentum whatsoever. Friday, sellers took over. Now it is sitting right on 1,180, which is crucial. On a daily chart, there is now a bearish MACD crossover. To rub salt to the wound, for the second consecutive week, gold moved with the dollar. And weekly momentum indicators are weakening. The onus is on gold bugs to prove their mettle.
Non-commercials remain hopeful.
Currently net long 101.2k, up 2.8k.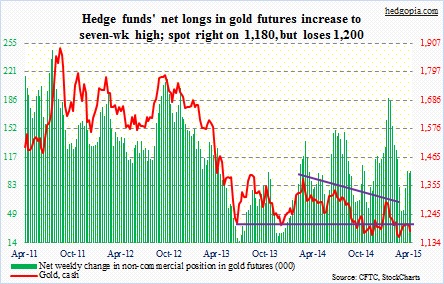
Nasdaq 100 index (mini): You have to hand it to these traders! They have steadfastly stayed on the right side of this trade, raising their net longs even when things were looking a bit shaky. Their reward is a fresh all-time closing high for the index.
QQQ has convincingly broken out of 109, thanks to markets’ Friday reaction to earnings from MSFT, AMZN and GOOGL. Will this streak continue? AAPL reports Monday. For the most part, expectations have been moving higher (iWatch, iPhone, etc.). Markit, for instance, expects AAPL to raise its quarterly dividend to 51 cents from 47 cents. The company is under pressure to deliver more goodies to surprise the market. We will see. It plans to return $130 billion to investors through 2015, of which $103 billion has already been returned. Markets are betting AAPL will not disappoint. After 18 sessions of straddling its 50DMA, the stock finally lifted off of it on Wednesday. Options are currently pricing in a $7 move – either way – post-earnings – enough for a new high if the reaction is to the upside.
Now this spoiler alert! The Nasdaq jumped 0.7 percent on Friday. There were, however, more decliners than advancers – 1,465 versus 1,260 – and volume on the downside was more than on the upside. Generals are leading the action, soldiers are staying behind.
Currently net long 70.2k, up 2.1k.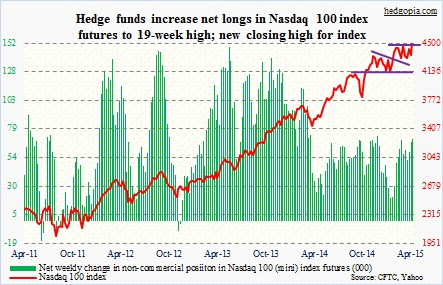
Russell 2000 mini-index: This was a week in which action was in the large-cap arena. Both the S&P 500 large cap index and the Nasdaq 100 enjoyed new highs (intra-day and closing, respectively), no such luck for the Russell 2000 small cap index. The latter did break out in the middle of last week, only to give it back two sessions later. As a reminder, the Russell 2000 began leading its larger brethren last December, but has been lagging all this month. So for proponents of ‘risk-on, risk-off’, small-caps lagging probably does not bode well. But increasingly it seems like markets have no memory. Right here and now, traders fancy large-caps. Small-caps just have to deal with it.
Do these traders fear a breakout in small-caps? They did cut net shorts to a one-year low.
Currently net short 4.5k, down 6.7k.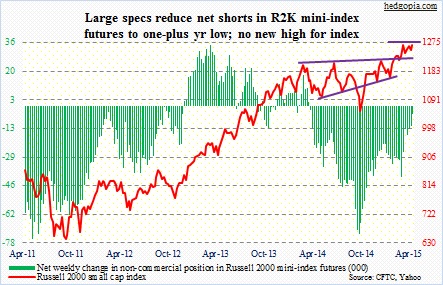
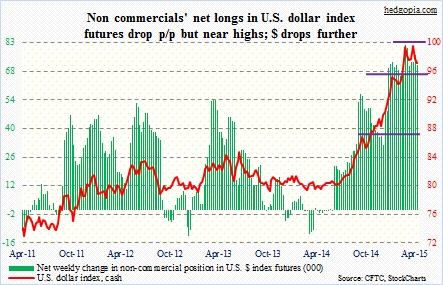
U.S. Dollar Index: Here is an irony. The dollar stays strong because dollar bulls expect the Fed to tighten. The Fed probably would not tighten if the dollar continues to stay strong. In the current earnings season, if there is one persistent theme it is one large company after another telling us how the strong dollar is hurting business.
Fundamentally, there is a lot to like the greenback – ranging from shrinking U.S. current account deficit (from 5.8 percent of GDP in 2006 to 2.4 percent in 2014) to interest-rate differential to massive increase in dollar borrowing by foreigners ($9 trillion owed by sovereigns and corporates) to increase in the dollar’s share in global foreign reserves (63 percent currently versus 60 percent in 2011) to plain old momentum. But these are also known factors, and probably in the price already, which is reflected in non-commercials’ massive net longs.
Hence how the dollar has been acting of late deserves close attention. The U.S. dollar index has been in a downward trend since mid-March. Yesterday, it lost 50DMA, though ever so slightly, and is at risk of losing horizontal support. Should that happen, we will start hearing talk of a double top. To boot, there is now a bearish MACD crossover on a weekly chart.
Right at this moment, the dollar has a lot going not going for it. I have said it before, and will do so again – the mid-March high of 100.71 will prove to be an important price at least in the medium-term. And, needless to say, this can have implications across asset classes – from commodities to equities to inflation outlook to interest rates.
Non-commercials are not budging an inch from their bullish stance, though.
Currently net long 71.7k, down 4.7k.
VIX: Since last Friday when the initial push higher got vehemently rejected by the 200- and 50-day moving averages, spot VIX has lost 2.7 points. Twice this week, a mid-day attempt to rally was meted out the same treatment (the chart does not show it as it uses weekly close; as well, it is best seen in a candlestick chart). In the process, it has lost – though not convincingly – July 2014 trendline support.
There is no love for fear. Having said that, the CBOE put-to-call ratio and the ISE index are not that far away from flashing complacency. As of Friday, 21DMA readings for the former stood at .63 and the latter at 169; stocks have shown a tendency to take a breather as the former in particular reaches high 50s to low 60s. As well, the VIX to VXV ratio closed out the week at 0.81. One-month volatility is very cheap compared to that for three months. This tends to mean-revert. As they say, party hard, but dance near exit.
Currently net short 59.9k, down 3.5k.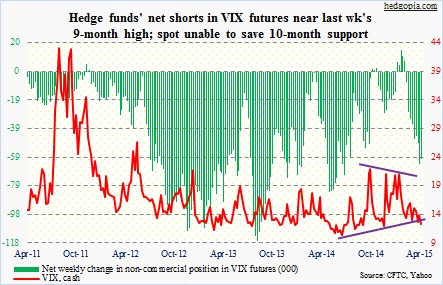
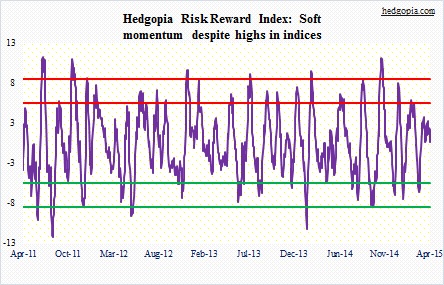
Hedgopia Risk Reward Index