The following are futures positions of non-commercials as of March 24, 2015. Change is week-over-week.
10-year note: After what these traders heard out of the FOMC last week, they decided to step on the accelerator. Net shorts went up 67 percent. The tactic worked for half of the week. The 10-year yield fell to 1.85 percent by Wednesday, before rallying hard. As a result, the yield briefly fell out of the one-and-a-half-year channel it is in. Weekly technicals in particular have plenty of room to still head lower. We will see what next week brings. It is a data-packed week.
Friday of course is the big day – March’s non-farm payroll is published. All eyes will be focused on wage gains, or a lack thereof. Mid-week, we also have ISM manufacturing, which since the 57.9 in October has dropped for four consecutive months. Orders peaked at 63.9 in August, and February was more than 11 points lower. This is in agreement with the persistent weakness seen in orders for non-defense capital goods ex-aircraft (proxy for business capX), which also peaked in August.
Then there are at least 10 Fed officials scheduled to speak, including Chair Yellen. They probably will all say we are data-dependent, yet will manage to send diverging signals. Isn’t the Fed always supposed to be data-dependent, by the way?
Currently net short 179.8k, up 72.3k.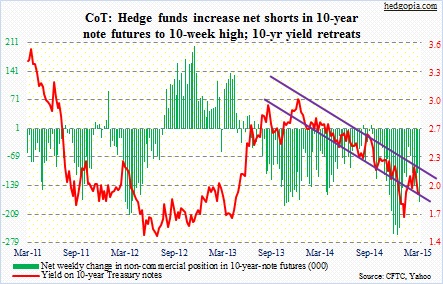
30-year bond: This is one heck of an undecided bunch of traders. After increasing net longs to a 16-week high last week, they cut back by more than half this week. The past two weeks, the 30-year yield has sat right on support – 2.5 percent. As is the case with the 10-year, in the right circumstances weekly technicals have room to come under pressure. That is not going to come from the Fed officials scheduled to speak next week. Most of them will continue to hint at a possible rate hike later this year. What will move these bonds include wages (employment report), and orders and prices trends (ISM). The ISM prices index in February stood at a mere 35, down from 59.5 as early as September.
Currently net long 12.4k, down 16.6k.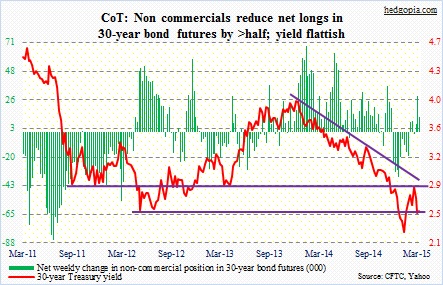
Crude oil: The WTI was able to further build on the improvement seen in price action last week. Of course, the catalyst did not come from specifics such as inventory or production or rig count. It came from Yemen, and the fears surrounding the Bab-el-Mandeb chokepoint. In and of itself, Yemen and its production is not much of a big deal (just north of 100k barrels/day). Especially because there is surplus industrywide. The big issue is Iran’s response to the Saudi move. If the former does not react in a belligerent way, crude probably cannot just rally on Yemen headlines. In this scenario, the 53-54 resistance should continue to draw sellers. It is a different game if and when that level gets taken out. Non-commercials continue to cut back net longs.
Currently net long 241k, down 30.5k.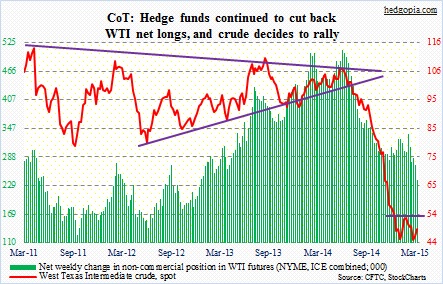
E-mini S&P 500: They quickly turned tail. From increasing net shorts to a nine-month high last week, they cut back by more than half this week. Reason? The S&P 500 large cap index rallied strong last week. As fate would have it, the index dropped 2.2 percent this week. They mistimed this, but are probably on the right track, at least in the near-term.
During the week, biotechs and semis really took it on the chin – down five and four percent, respectively; at one point, it was worse. The good thing – for now – is that bids showed up on crucial support – 50-day moving average on IBB and 52.50 horizontal support on SMH.
In the immediate weeks ahead, the lack of corporate buybacks is a serious headwind, due to a blackout period. For reference, in 2014, buybacks were $553 billion, highest since $589 billion spent in 2007 (courtesy of S&P). Just in February, announced stock buybacks in the S&P 500 hit a monthly record of $104.3 billion. On the other hand, 1Q comes to an end next week, and it is possible institutions try to push prices up. Sellers will go on strike. As simple as that. Just for the heck of it. The week after next, 1Q earnings season begins. And the bar is low.
Medium-term, however, there are worries. Transports peaked four months ago. The NYSE composite has not made any progress since July last year. If things do not improve in the last two remaining sessions, the S&P 500 will have a monthly MACD crossover in March.
Currently net short 44k, down 49.9k.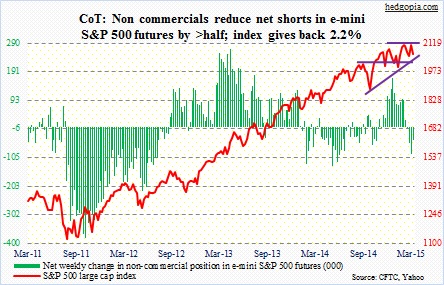
Euro: They are piling on. Net shorts are the highest ever. In the past two weeks, they have increased positions by 22 percent, even though the euro has rallied four percent. One look at the chart below, and it is easy to see how well these traders have ridden the euro downturn. But this is also a group that does a great job riding a trend, but more often than not misses inflections. Are we at an inflection point? It is a tough call. As far as 1Q macro trends go, they are better in the euro zone than in the U.S. Will that be enough for market participants to change dollar/euro allocations? We will see. For now, the 110 resistance on FXE will not be easy to conquer.
Currently net short 221k, up 27.2k.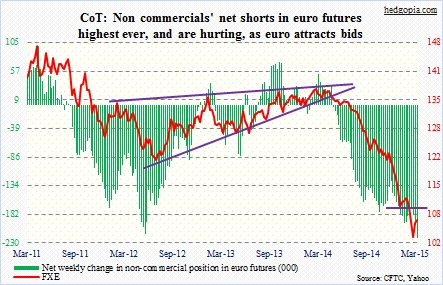
Gold: The metal’s near-term fate likely will be decided by whichever emerges victorious between weekly and daily indicators. The former is oversold, and the latter overbought. Sellers showed up quickly near 50DMA on Thursday, in the process creating a not-so-good-looking candle. Prior to Friday, spot gold has had seven consecutive up days. You don’t see that very often. Perhaps time to digest that move.
Currently net long 54.3k, up 1.2k.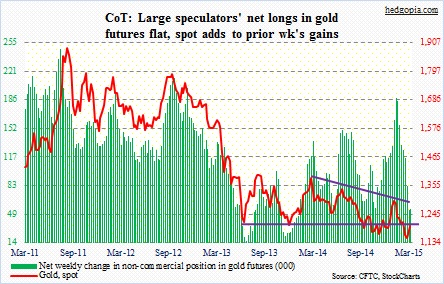
Nasdaq 100 index (mini): As did the semis and biotechs, QQQ, too, found support at a crucial level. After Wednesday’s rout, the 104 support, which corresponds with 100DMA, held Thursday. For now, bulls have the baton, and it is their loss if they cannot build on it. Having said that, several weekly momentum indicators are already pointing down; there already is a bearish MACD crossover.
Here is the thing. If one were to look at stocks through the eyes of earnings and macro – both are weakening – in normal times stocks would probably be much lower. But investors instead have been looking at stocks through the eyes of artificially suppressed discount rates, which artificially boosts multiples/stock prices. The longer this goes on, the greater the pain when this comes to an end.
These traders definitely do not think we are at that point yet.
Currently net long 60.8k, up 3.4k.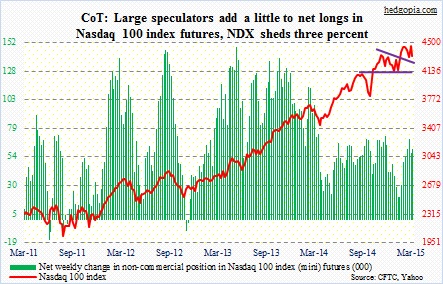
Russell 2000 mini-index: They seem to have finally decided to give up. From nearly 41k a couple of weeks ago to 13k, net shorts have come crashing down. Sort of. They are now at an 11-month low. Who can blame them? Of late, small-caps have continued to outperform their larger-cap brethren. During the sell-off this week, the recent breakout was not retested, but it came close. For whatever reason, there is an interest in owning these stocks. The Russell 2000 volatility index (RVX) quickly shot up to 19-plus but was rejected at its 200DMA; it is likely headed lower.
Currently net short 13.3k, down 13k.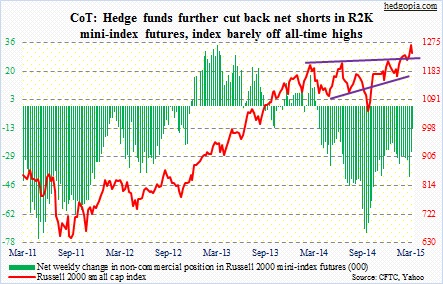
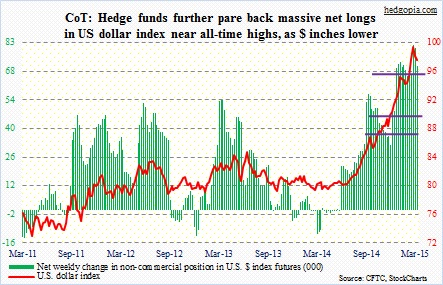
U.S. Dollar Index: No, the dollar bulls are not giving up that easy. On Tuesday through Thursday, they persistently stepped up to support the December (2014) trendline. Of course, the index never got to test the 96 level, where horizontal support converges with 50DMA. So anything can happen next week, or in the near-term, but medium- to long-term, last week’s 100.71 has the potential to be an important high at least for a while. Weekly momentum indicators are beginning to turn down. And March’s candle has an ominous look to it on a monthly chart, with only two days left to repair.
Currently net long 71.2k, down 8.5k.
VIX: They were not deterred one bit by what happened last week, when they added to net shorts, only to see the S&P 500 rally two-plus percent. This week, they added even more, pushing it to a 24-week high. The way spot VIX is trading right now, market participants seem split right down the middle – unable to decide. Amidst this confusion, the spot tried to retake its 50DMA on Thursday and failed. That average is now decidedly pointing down. Currently net short 46.1k, up 10.2k.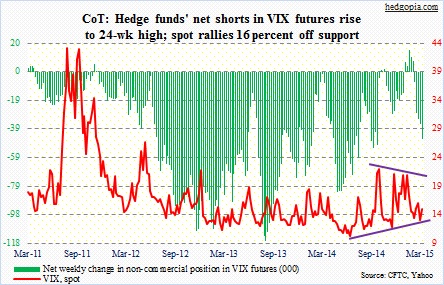
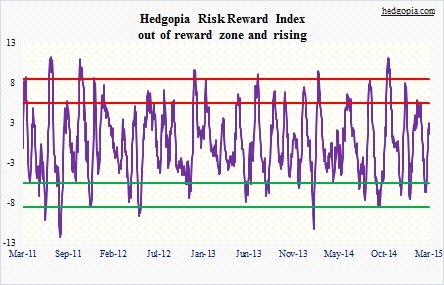
Hedgopia Risk Reward Index