
 The U.S. jobs market seems to be on the mend. Or so it seems. June produced the fifth consecutive month of 200k-plus non-farm jobs, for a monthly average of 248k. The last time the economy churned out five consecutive months of 200k-plus jobs was in September 1999-January 2000, for a monthly average of 286k. Though one would not want a repeat of what that late-1999/early-2000 surge in jobs led to – a severe recession accompanied by the pricking of a massive stock-market bubble – recent pickup in job creation in an otherwise sub-par recovery is welcome indeed. How sub-par? The economy had to wait until May this year and five years of growth to surpass the previous cycle high of 138.4-million in non-farm employment (in January 2008); June 2014 was 138.8 million. Despite the 288k addition last month, the report still left plenty of fodder for bond bulls/equity bears/macro pessimists. Here is the oft-cited data point: the number of full-time jobs dropped 523k to 118 million even as part-time jobs jumped by 799k to 28 million. Year-to-June, 926k full-time jobs have been created; 646k are part-time jobs.
So did the June report give out mixed signals then?
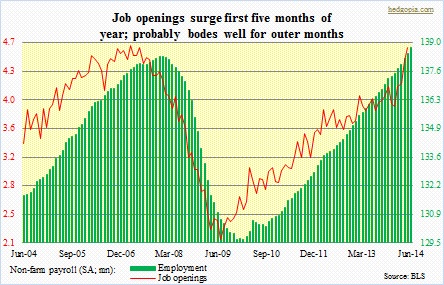
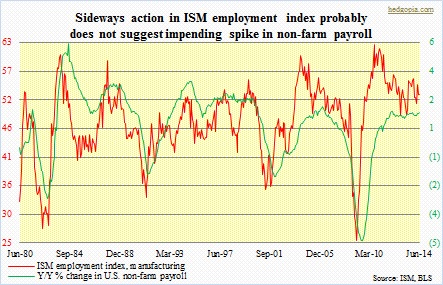 Time will tell, but we can definitely see mixed signals emanating from other relevant/related data points. The Bureau of Labor Statistics also puts out what is known as JOLTS (Job Openings and Labor Turnover Survey). The series Job Openings (non-farm), which tends to lead employment (non-farm) by several months, came in at 3.9 million in January, then progressively surged month by month to 4.1 million, 4.2 million, 4.5 million and 4.6 million. If this relationship (chart above) holds, then we are at least looking at a few more months of strong job creation, regardless it is full-time or part-time. Then we have this. In the accompanying chart, the ISM employment index, manufacturing, is plotted against year-over-year percent change in non-farm payroll. As is evident, they track each other well, with the former leading by a few months. Since November 2011, the ISM employment index has pretty much gone sideways, with brief spurts to mid-50s and drops to high-40s. Ditto with ‘y/y percent change in non-farm payroll’, which has ranged between y/y increase of 1.5 percent and 1.9 percent. Now if the recent strength in Job Openings is indeed a sign to come and the economy continues to add, let us say, a couple more months of 200k-plus jobs, then we are looking at a y/y growth in non-farm payroll of three to four percent in July and August – meaning that green line will see a sharp spike. And this is exactly what is not being forecast by the ISM employment index. Remember the latter tends to lead.
