
The latest productivity report had observers buzzing more about unit labor costs than output per hour.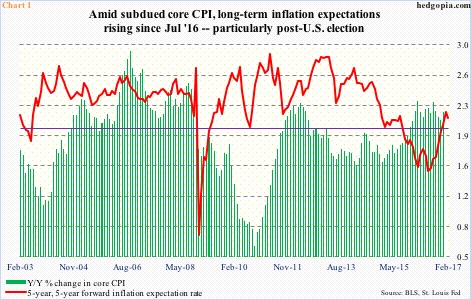
In 4Q16, unit labor costs jumped at an annual rate of 1.68 percent, up from 0.18 percent in 3Q16.
This comes in the wake of a jump in inflation expectations particularly post-Nov 8 U.S. presidential election. The five-year, five-year forward inflation expectation rate bottomed at 1.54 percent last February, and was at 1.79 percent in October. Last Friday, it stood at 2.13 percent, down from 2.22 percent on January 26 (Chart 1).
The sharp rise in expectations comes amidst rather subdued reading in core CPI (consumer price index). Yes, the latter has been north of two percent for 14 straight months, but it remains subdued in a larger scheme of things.
As are wages.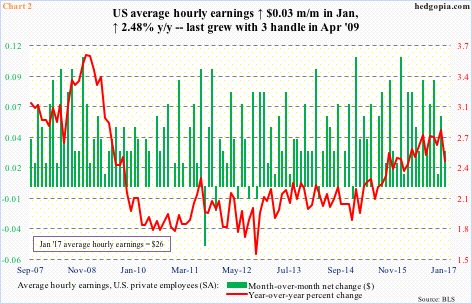
Average hourly earnings of private-sector employees are relevant here. In January, they rose 2.48 percent year-over-year to $26, down from cycle high 2.81 percent in the prior month. The December high was the highest since May 2009. Wage growth is one of the missing pieces in the current recovery. The last time wages grew y/y with a three handle was in April 2009.
As subdued as wage growth has been, what are we to make of the rising unit labor costs? Is wage-push inflation around the corner? Or, what are the odds the 4Q16 jump in unit labor costs persists?
Not much is the short answer.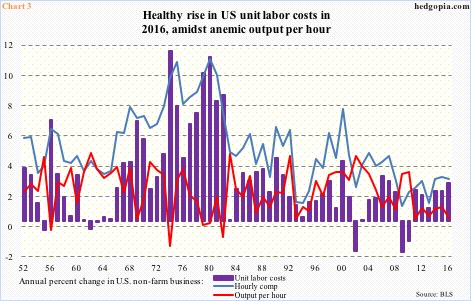
Unit labor costs roughly equal the difference between growth in hourly comp and output per hour. For instance, hourly comp grew 2.77 percent in 2016, even as output per hour inched up 0.2 percent – hence increase in unit labor costs of 2.56 percent. This was the highest growth rate since 2.65 percent in 2007, and followed two-percent growth each in 2014 and 2015.
Notice the massively underperforming red line in Chart 3. Output per hour has come in sub-one percent for the last six years. This is a crucial statistic.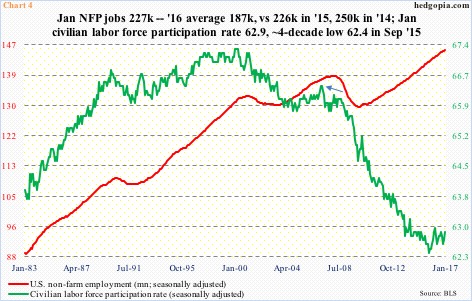
Productivity is the difference between output and hours worked. In 2016, for instance, output grew 1.7 percent, and hours 1.5 percent, for output per hour growth of 0.2 percent. Obviously when output rises faster than hours, productivity comes under upward pressure.
Typically, an economy grows at the rate at which the labor force is growing and how much each worker can produce, plus what percentage of the labor force is participating.
The civilian labor force grew from 154.7 million in June 2009 (when Great Recession ended) to 159.7 million this January. But the ‘not in labor force’ category expanded from 80.9 million to 94.4 million during the period. From 66.4 percent in January 2007 (arrow in Chart 4), the civilian labor force participation rate literally collapsed until some semblance of stability of late.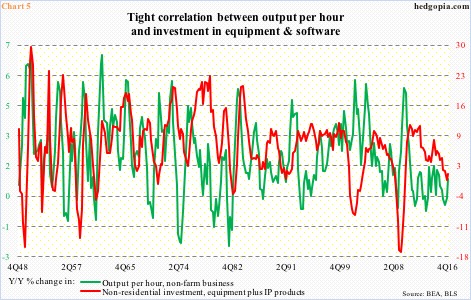
There is tight correlation between productivity and capital expenditures.
Chart 5 plots y/y growth in output per hour with non-residential investment in equipment and intellectual property products. The latter peaked in 2Q12, persistently came under pressure, even dipped into negative territory in 3Q16, before inching up 0.7 percent in 4Q16.
The post-Great Recession recovery is nearly eight years old. If corporations have not opened up their wallet thus far, it is probably safe to assume that they would not get capX-aggressive this late in the cycle … which means sluggish productivity continues.
In this scenario, the recent jump in unit labor costs probably does not represent the start of a trend. As noted above, unit labor costs can be arrived at by subtracting productivity from hourly comp. In the event productivity does not significantly improve, companies will eventually be forced to either cut back wages or hours, or both. In the latter scenario, the economy gets hit. Either way, wages suffer.
Thanks for reading!
