
Ten and counting. That is the number of weeks spot West Texas Intermediate crude ($53.78) has now gone flat.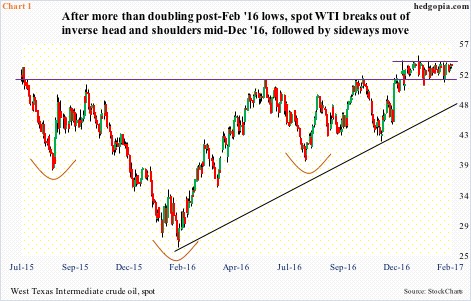
Oil bulls hope this is consolidation before another leg higher. Since oil bottomed at $26.05 on February 11 last year, it more than doubled to the January 3, 2017 high of $55.24. The current sideways pattern could very well be part of a continuation pattern.
To boot, WTI has charted out a potentially bullish inverse head-and-shoulders pattern (Chart 1). The neckline lies around $52, which has been successfully tested several times, with the crude closing above that level in all those 10 weeks.
However, bulls have been unable to convincingly take out $54. This gives bears the hope and the reason to stay put. Plus, there is Chart 2.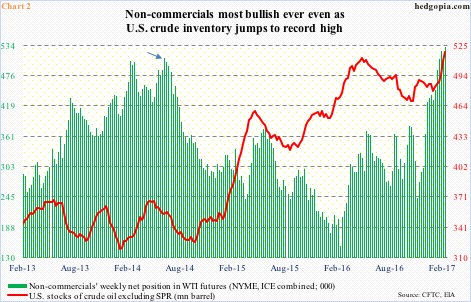
In the latest week, non-commercials were the most bullish ever in WTI futures. As of last Tuesday, they held 530,382 net longs (both NYME and ICE combined). This is higher than what they had during the prior peak (arrow in Chart 2).
Back then, in the week ended June 17, 2014, these traders were net long 509,833 contracts. WTI peaked on the 13th that month at $107.68. By the time it bottomed in February last year, it had collapsed 76 percent. Concurrently, non-commercials’ holdings bottomed at 152,814 contracts in the week ended February 16 last year.
Chart 2 plots non-commercials’ WTI holdings with U.S. crude inventory. Back in June 2014 when these traders’ net longs peaked, crude inventory was fairly contained – around 350 million barrels. This time around, at 518.1 million barrels, it is at a new record (data goes back to August 1982). Not a nice combo – non-commercials are the most bullish ever even as inventory jumps to a record.
[Incidentally, gasoline stocks, at 259.1 million barrels, also are at a new record (data goes back to January 1990). Distillate stocks last week shrank 689,000 barrels to 170.1 million barrels, but the prior week was the highest since October 2010 (not shown here).]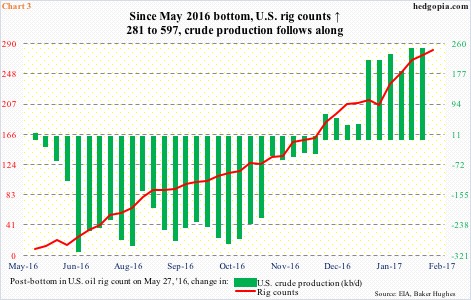
Importantly, as noted above, crude price bottomed one year ago. This preceded a bottom in U.S. oil rig counts. In the week ended May 27 last year, rig counts troughed at 316, down from 1,609 on October 10, 2014. Since that bottom, rig counts have gone up to 597 – up 281, which is what Chart 3 shows. U.S. crude production is following rig counts higher.
Production peaked at 9.61 million barrels per day in the week ended June 5, 2015. (For reference, in early 2009 production was south of five mb/d.) Since that peak, production fell by 1.18 mb/d before bottoming at 8.43 mb/d in the week ended July 1 last year. Since that low, production has gone up by 549,000 b/d, and since the bottom in rig counts by 242,000 b/d, which is what Chart 3 shows.
This is hardly good news from the viewpoint of the red line in Chart 2.
With all this as a background, that neckline at $52 (Chart 1) is crucial. Odds favor in due course it is lost, and once that happens, non-commercials will come under pressure to begin to unwind their net longs.
Thanks for reading!
