
If a chart gets retweeted 86 times, it is safe to say that the topic in question has touched a nerve in Twitter finance.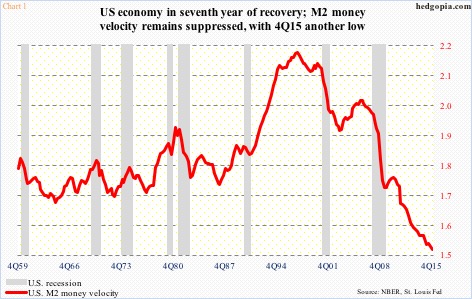
The chart above had that distinction. The topic it highlighted thus deserves a post. So here it is.
Velocity of money measures economic activity of a nation. Simply put, it is the turnover in the money supply, and tells us how long people hold onto their money. As simple as that. Its role cannot be emphasized enough… probably why Chart 1 generated so much interest to begin with.
But there probably is another reason as well for the attention it got.
One look at the chart, and it is easy to notice that this cycle has been very atypical. Going back to 1959 – a period covering eight recessions – M2 money velocity has shown a tendency to turn up a couple of years after recovery has begun. Not this cycle.
The U.S. economy is five months from completing seven years after the end of Great Recession. Yet, the red line in Chart 1 keeps making one after another low.
Velocity is a ratio of nominal GDP to money supply – in this case M2. Since Great Recession ended, nominal GDP has grown just north of 26 percent, to $18.1 trillion. M2 money supply (seasonally adjusted) during the period grew from $8.4 trillion to $12.3 trillion, for an increase of 47 percent. Velocity dropped from 1.71 to 1.48.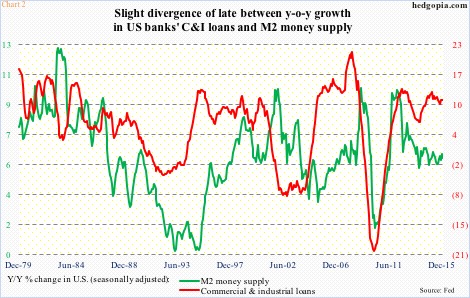
Year-over-year, M2 money supply has been growing in the five-to-six percent range for over two years now. Directionally, it is tracking growth in U.S. banks’ commercial & industrial loans well, with slight divergence of late (Chart 2). Since Great Recession ended, C&I loans have expanded nearly 38 percent, to $1.98 trillion.
So, broadly speaking, in the M2 money velocity equation, the denominator is doing just fine, it is just that the numerator is not keeping pace.
Makes you wonder how banks’ excess reserves would fit into all this. Can we envision a scenario in which the red line in Chart 1 continues lower?
Yes, there is one scenario.
To refresh, for the first time in nine years, the Fed hiked in the middle of last December, raising the target rate for the fed funds rate to 0.25 percent-0.5 percent. At the time, the FOMC’s dot plot projected four quarter-point hikes this year. This week, both Stanley Fischer, Fed vice-chair, and William Dudley, president of the New York Fed, all but said that would not happen. Markets are acting jittery, and growth is decelerating globally.
The Bank of Japan just instituted negative interest rates. The ECB is already there. Having tried both zero interest-rate policy and quantitative easing – and not much to show for – logically the Fed at some point in the future can be expected to try out negative interest rates.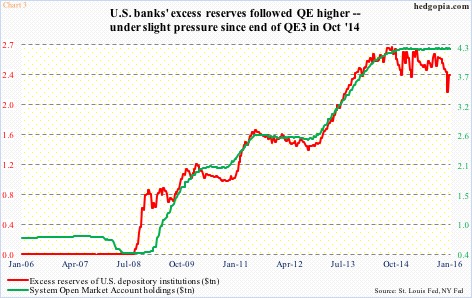
Enter U.S. depository institutions’ $2.3 trillion in excess reserves, which have moved in tandem with three iterations of QE (Chart 3). Currently, the Fed pays 25 basis points on these reserves. These are not being used to expand bank credit, hence the money supply. (The Fed began paying interest on reserves, for the first time in history, in October 2008.)
Should the Fed wade into the negative-interest land, banks will come under pressure to loan out these reserves. At least that is the idea. If it worked as we are told in theory, ZIRP would work. So would QE.
But for the sake of this post, let us assume that, in response to negative interest rates, banks attempt to lend out their excess reserves. This would put upward pressure on the money supply, potentially giving birth to a scenario in which the denominator rises much faster than the numerator, exerting downward pressure on the ratio.
Thanks for reading!
