
Short squeeze played a big role in the equity rally since the February lows this year. Charts 1 and 2 are proof.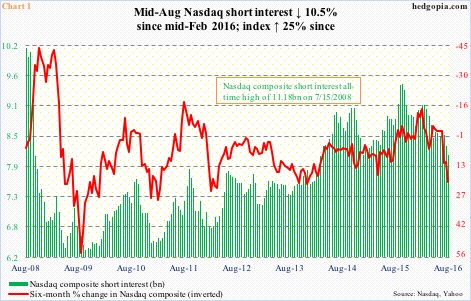
Since the February 11th bottom through the all-time high this Tuesday, the Nasdaq composite rallied just north of 25 percent. From that low through the August 15th high, the NYSE composite rallied north of 21 percent.
Short interest between mid-February and mid-August this year fell by 10.5 percent on the Nasdaq (Chart 1) and by 13 percent on the NYSE (Chart 2).
Both charts show six-month percent change in these indices. Directionally the inverted red line shows a tendency to follow the green bars.
Equity bulls for sure hope this continues.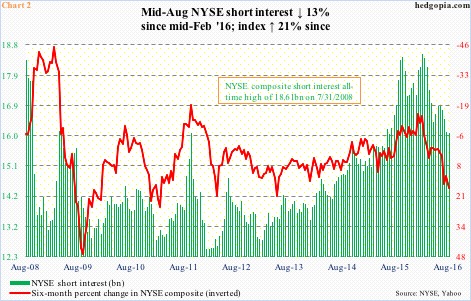
In the latest period (July 29-August 15), the NYSE composite was up 0.7 percent, and the Nasdaq composite 1.9 percent. Short interest dropped 0.1 percent period-over-period to 16.1 billion on the NYSE and by 2.1 percent to 8.1 billion on the Nasdaq. The all-time highs respectively were 18.6 billion and 11.2 billion in July 2008.
Versus those highs, the current level of short interest is low, but in a larger scheme of things remains elevated. In the right circumstances for the bulls, short squeeze can still take place.
The one that began in February this year owes a lot to oversold technicals, which have now moved into overbought territory.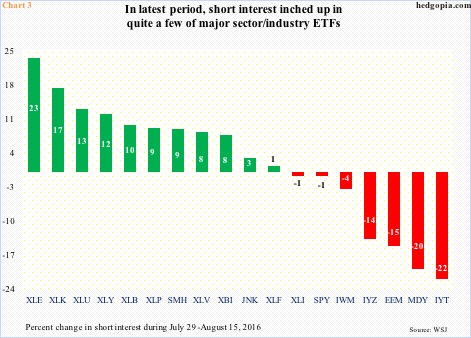
Major indices have been sideways for a month now, with the S&P 500 large cap index on the verge of a bearish cross-down between 10- and 20-day moving averages. Traders are probably anticipating this.
On a sector/industry level, in the latest period short interest rose on several ETFs (Chart 3). Continued buildup is bound to result in selling pressure for now, but in due course could once again be a source of squeeze.
Shorts have gotten the fundamental story right, but the Fed put has so far denied them of making a killing.
Thanks for reading!
