
Over the weekend came news that OPEC and non-OPEC producers had taken 1.5 million barrels per day out of the market. They had earlier agreed to output cut of 1.8 mb/d in the first six months this year.
OPEC first reached an agreement to cut output on September 28 last year. Later on December 10, non-OPEC producers including the big honcho Russia joined by pledging to cut output by 558,000 b/d.
Markets were on pins and needles as to if the producers would comply.
So when OPEC announced the compliance news on Sunday, oil should have heaved a sigh of relief and rallied. Rally big, maybe. Come Monday (New York trading), spot West Texas Intermediate crude dropped 0.9 percent (although it rose 0.8 percent on Tuesday).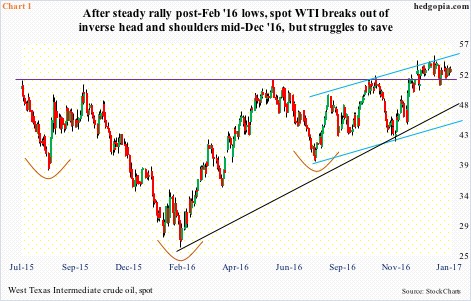
After a painful 76-percent collapse beginning June 2014, the spot bottomed early February last year at $26.05/barrel. From that low through the intra-day high of $55.24 on January 3, it more than doubled, along the way charting out a potentially bullish inverse head-and-shoulders pattern (Chart 1).
Spot WTI ($53.18) is still above the neckline, but building on the December 12 breakout has been tough sledding. In fact, leading up to this week, six out of seven weeks produced weekly dojis.
The Sunday news was unable to break this logjam.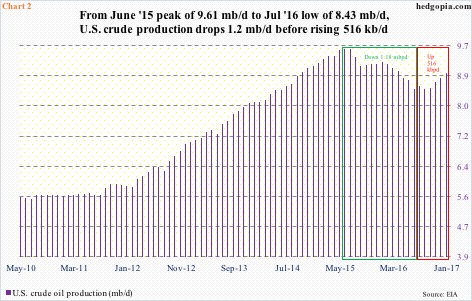
First, oil has priced in a lot already.
Since OPEC’s production-cutback announcement in late September last year through the high early this month, spot WTI jumped nearly 24 percent. Not to mention the more than double since February last year.
Second, U.S. shale is front and center – again. It has proven its resiliency. When spot WTI began to retreat after hitting $107.68 intra-day on June 13, 2014, U.S. crude production stood at 8.48 mb/d.
Despite the price collapse, it would be one more year before production would peak at 9.61 mb/d in June 2015. By early July last year, it was down to 8.43 mb/d. That is a drop of 1.2 mb/d from the peak. This is denoted by the green box in Chart 2. Since that bottom, production has already gone up by 516,000 b/d to 8.94 mb/d (red box).
Since OPEC first announced its intention to curtail production in September last year through last week, U.S. production has gone up by 477,000 b/d.
In other words, OPEC’s output cut has helped give a boost to U.S. production.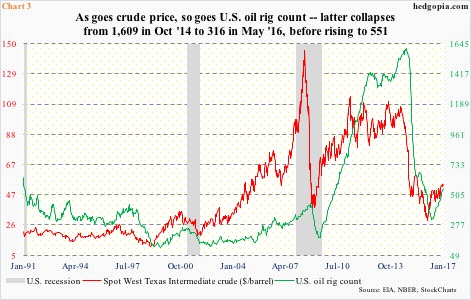
Chart 3 plots U.S. oil rig counts with the spot price of crude, and the relationship between the two could not be starker.
In October 2014, there were as many as 1,609 rig counts in operation. Then came the waterfall dive … which then bottomed at 316 in May last year (Chart 3). The latest count is 551, up 29 week-over-week in the week ended last Friday.
In a larger scheme of things, this is miniscule versus where the rig count was at its peak, but at this juncture it is the trend that counts, and on this score, things are looking up.
Markets are watching this like a hawk – which would suggest the price of crude would be capped for the foreseeable future. And this could have implications for non-commercial futures traders’ holdings.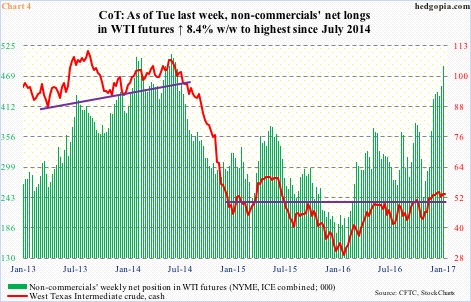
As of Tuesday, these traders held 487,689 net longs in WTI futures (both NYME and ICE). These were the highest since July 2014. The problem is that the crude has essentially gone sideways since early December, even as non-commercials’ net longs in WTI futures have gone up by 62 percent. These positions are merely treading water.
If Monday’s lukewarm reaction to good news is any sign, the status quo probably remains.
For the sixth straight week, oil bulls have now been rejected at $54-plus on spot WTI. Thus far, $52 has been defended, but it is probably only a matter of time before this gives way.
A rising trend line drawn from the February lows last year converges around $48. The 200-day moving average lies at $47.51.
Thanks for reading!
