
Down 5.6 percent from intraday peak to trough in 19 sessions, and then up 4.1 percent from low to high in five. The Russell 2000 small cap index continues to play ping pong between range support and resistance.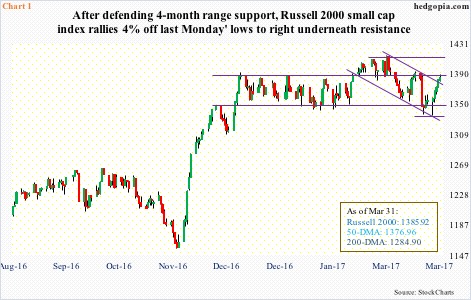
Last Friday, it nearly tagged the upper end of the nearly four-month range before backing off. The rally started Monday when the bulls hammered out a hammer session. The subsequent rally not only recaptured the 50-day moving average, which is flattish to ever so slightly rising, but also a declining trend line from March 1 (Chart 1).
In longs versus volatility last week, the latter blinked, with RVX, the Russell 2000 volatility index, losing 4.6 points in five sessions before attracting bids Friday, when the Russell 2000 lost 0.3 percent in the last half an hour.
Shorts can get active here, or longs can get tempted to sell.
The bigger question is, why is the Russell 2000 range-bound even as its large-cap peers have gone on to score newer highs?
One answer is, it is merely digesting the post-election gains. From November 9 last year through March 1, it rallied just north of 18 percent. If recent action is merely consolidation, in due course it is headed much higher. That is the bullish argument.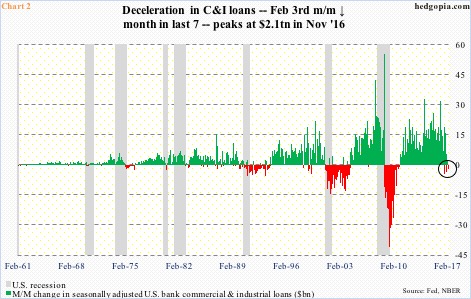
A counter-argument is, it rallied all right, but hard data has failed to come through.
Take banks’ commercial & industrial loans, which have had a monthly decline in three of seven months (Chart 2). The first drop took place last August – pre-election – but the next two were last December and this February. Prior to this, the last time C&I loans fell month-over-month was in October 2010. We are not talking chump change. This is a $2.1-trillion market – peaked last November.
On the other hand, post-November 8 election, survey-based soft data (small-business optimism, consumer sentiment, etc.) took off, responding to the Trump administration’s promises to cut regulations, cut taxes and increase infrastructure spending.
By nature, small companies are domestically focused.
In general, they pay higher tax rates vis a vis large companies because the latter has the luxury of socking away profits overseas. So small-caps can benefit more. At least in theory, a drop in the tax rate can further boost their P/E.
Here is the rub.
The last major tax overhaul took place during the Reagan administration. He came into the office in 1981 promising one. Marginal income tax rates were reduced that year, the deficit rose, and tax revenues fell. Then in 1982, some of the effects of the 1981 tax cuts were backed out. It was not until October 1986 that a major overhaul was signed into law.
Tax cuts are easy. President Trump talks about a massive tax relief for the middle class. But to devise a revenue-neutral tax reform, which is where Congress’s focus lies, takes time. If the recent healthcare fiasco is any sign, the tax journey ahead is not going to be a smooth ride.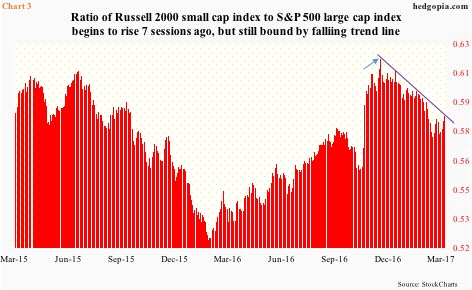
Hence the confusion writ all over in how the Russell 2000 is acting. The good thing, as far as the bulls are concerned, is that it came very close to breaking down last week but was saved on time. On March 17, it fell out of the range, dropping to 1335.04 before pushing higher. Similarly, there was a false breakout on February 13.
Throughout all this, small-caps lagged their large-cap peers. The ratio of Russell 2000 to the S&P 500 large cap index shot up post-election, but peaked just about the time the Russell 2000 began to go sideways (arrow in Chart 3). Most recently, it bottomed seven sessions ago, with last Friday kissing the downtrend line.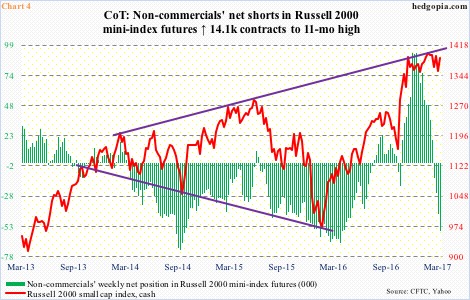
Should a breakout occur, there are some potential tailwinds that might help the bulls.
Non-commercials rode the post-election rally in small-caps perfectly. By the week ended January 3, they were net long a record 92,652 contracts in Russell 2000 mini-index futures. Then they began to cut back, going net short four weeks ago. Net shorts as of last Tuesday were at an 11-month high. They are showing some aggression, and they might be forced to cover should small-cap bulls manage to force a breakout on the cash.
Along the same lines, mid-March short interest on IWM, the iShares Russell 2000 ETF, stood at 108.1 million, down 8.1 percent period-over-period but up 15.3 percent from mid-January – potential fuel for a squeeze in the right circumstances.
With all that said, until a range breakout occurs, the trade has been to short resistance and buy support on the Russell 2000.
Thanks for reading!
