
Two thousand and seventeen has gotten off to a good start. U.S. stocks quickly shook off the nervous energy of the last week of December.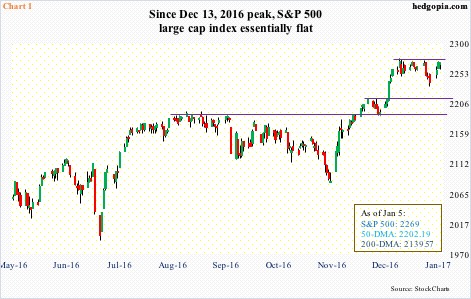
On December 27, the S&P 500 large cap index had a go at the December 13th all-time high of 2277.53, only to close up poorly. In the next session, it lost the 10-day simple moving average, and one session later the 20-day. Bulls needed to recapture these averages for continuation of near-term momentum. And they did that.
The index rallied 1.4 percent in the first two sessions of the new year, reclaimed both those averages, and is now a stone’s throw away from the record high of last month (Chart 1).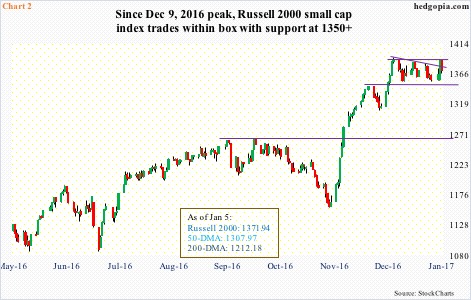
Over on the Russell 2000 small cap index, the story is similar.
As did the S&P 500, the Russell 2000 late last week lost both 10- and 20-day averages. Prior to this, rally attempts had been bound by a downtrend line from the all-time high 1392.71 on December 9. In the meantime, bids were showing up just north of 1350 (Chart 2).
Come 2017, that support continued to get bought, eventually resulting in a break out of that downtrend line on Wednesday. With this, the index literally sat on horizontal resistance from the afore-mentioned record high.
At this stage, bulls have the ball. If they force a breakout, the question is, what follows?
First off, on Thursday, the Russell 2000 got sold hard, and was pushed back below that trend line again. But it did bounce a tad off 10- and 20-day. Ditto with the S&P 500, which bounced off those averages to end the long-legged doji session essentially flat. Fatigue is setting in.
Between intra-day low and high on November 3 and December 9, the Russell 2000 rallied north of 20 percent – and north of 16 percent post election through that all-time high. Similarly, between November 4 and December 13, the S&P 500 rallied north of nine percent – and north of six percent post-election. All this in about five weeks, give and take.
Apparently, these indices have expended lots of energy to travel this far, with big help from flows.
From November 9 through this Wednesday, $23.1 billion moved into SPY, the SPDR S&P 500 ETF, and $6.8 billion into IWM, the iShares Russell 2000 ETF (courtesy of ETF.com).
This is reflected in sentiment readings as well, both survey- and actual money-based.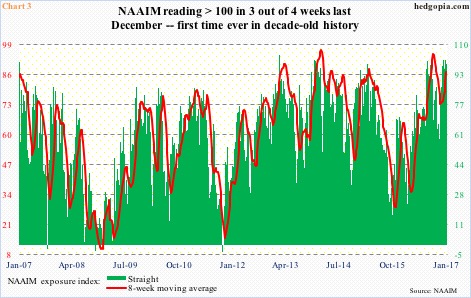
Take the National Association of Active Investment Managers exposure index, which represents the average exposure to U.S. equity markets of its members.
It is not often the NAAIM reading exceeds 100. In its decade-old history (goes back to July 2006), there have only been eight such times (below). Prior to last December, never did they exceed 100 in three out of four straight weeks. This feat was achieved last month (Chart 3).
100.05 (January 3, 2007)
104.25 (Jan 30, 2013)
101.45 (November 27, 2013)
100.69 (December 11, 2013)
101.02 (July 27, 2016)
101.60 (December 7, 2016)
101.33 (December 21, 2016)
100.60 (December 28, 2016)
In the latest week, the index fell 1.2 points week-over-week to 99.4. Needless to say, these are very high readings – and probably as good as pushing all the chips to the center of the table.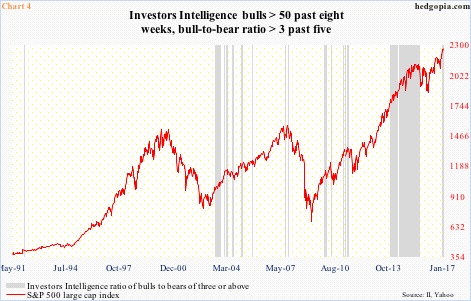
Survey-based polls are no less bullish.
Investor Intelligence bulls have exceeded 50 for eight straight weeks, with the reading this week north of 60. Chart 4 plots the S&P 500 with a ratio of bulls to bears of north of three. The latter is represented by grey bars. In the past five consecutive weeks, the ratio has exceeded three.
In the past, grey bars more often than not have coincided with downward pressure on the S&P 500 – magnitude and duration notwithstanding. That said, there was a preponderance of three or above between October 2013 and July 2015. Could this possibly repeat itself? Anything is possible. But is it probable right here and now?
As noted above, these indices have come a long way in a short span of time. Should a breakout occur, given how extended these sentiment readings are, it will be awfully difficult for the indices to genuinely build on that. The sentiment balance is tilted a little too much on one side, and probably needs unwinding first.
Thanks for reading!
