
Table 1 was posted in last Tuesday’s blog. It is apropos to be discussing it again.
The table tallies instances of rallies of five percent or above on the S&P 500 over four sessions. Going back six years, there have been 16 such instances. Between March and July in 2009, there were 13 more instances, and they have been excluded from the table. The bull market had just begun in March 2009, and such spurts were obvious and common. From 666.79 in March, 2009 ended at 1115.10.
Focusing on the 16 instances in the table, a trend emerges. Except for once, which was in June 2010, the S&P 500 was higher two months later in each of the remaining 15 instances. One-month change is not as consistent, nevertheless is higher 60 percent of the time.
This time around, post-Brexit, between June 27th and July 1st, the S&P 500 rallied 5.1 percent in four sessions. Hence the question, will history repeat itself?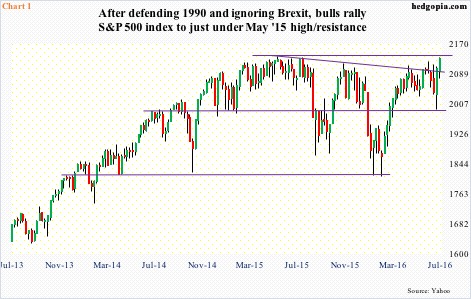
Since July 1st, the S&P 500 (2129.9) is up 1.3 percent, and had back-to-back hammer weeks (Chart 1). The two-session, 5.3-percent Brexit decline has been completely erased. Both 50- and 200-day moving averages have been recaptured, with the index right underneath the May 2015 high.
The index has essentially gone sideways the past 16 months. A breakout here has potential to be big. In fact, on a closing basis, it did break out last Friday, albeit by only a few points.
But what are the catalysts for a breakout? Friday’s 1.5-percent jump came on the heels of much-better-than-expected payroll numbers.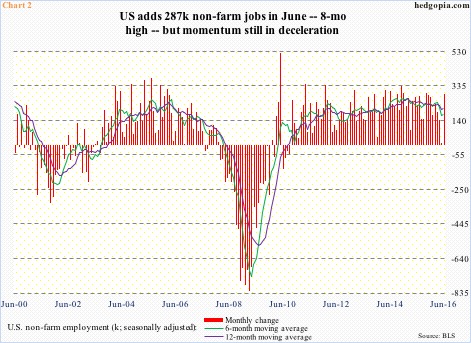
The U.S. economy added 287,000 non-farm jobs in June – an eight-month high. Having come on the heels of what was previously reported as 38,000 in May – now revised down to a mere 11,000 – the June jump soothed investor nerves. That said, momentum is still in deceleration, with the 6-month moving average below that of the 12-month in 12 out of the last 16 months (Chart 2).
But what could possibly be the next catalyst for equities, if at all?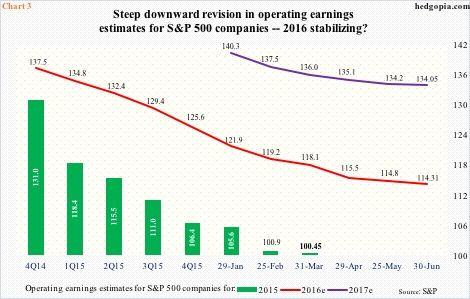
The 2Q16 earnings season is just getting started. If there has been one common theme in at least the past couple of years, it is the persistent downward revision in estimates (Chart 3).
Back in 2Q14, 2015 operating earnings for S&P 500 companies were estimated at $137.50. When it was all said and done, actual earnings came in at $100.45, down from $113.02 in 2014. Along the same lines, 2016 estimates in 4Q14 were, once again, $137.50. They have now been chopped down to $114.31. The latest data is as of June 30th.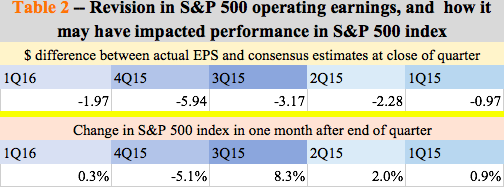
There is a pattern here. The earnings bar persistently gets lowered into the reporting season, and continues as numbers are reported. Table 2 highlights this phenomenon.
In 1Q16, for instance, when the quarter ended, consensus estimates were $25.94. This was already down from $30.91 a year ago. Then the reporting season began. By the time actual numbers were tallied, 1Q16 only earned $23.97, which was $1.97 less than what was expected when the quarter closed. This is what Table 2 shows – the difference between actual earnings and what was expected when the quarter closed.
Going back five quarters to 1Q15, each one of them ended up earning less than what was expected as the quarter closed. Logically, this should have put the S&P 500 index under pressure. Not so.
Within a month of the quarter-end – during which the majority of companies would have reported earnings – the S&P 500 is higher. In the aforementioned five quarters, 4Q is the only one this did not pan out. Otherwise, this has occurred like a clockwork.
Enter 2Q16. Post-Brexit sell-off was quickly snapped up. When the quarter ended 11 days ago, earnings estimates were $28.32, which five quarters ago stood at $33.27. The bar lowered enough for companies to comfortably jump over? Maybe. But even if estimates come up short – as has been the case in the prior five quarters – the S&P 500 can rally. Assuming history repeats itself.
This is what the bulls are hoping for. History – no matter how short – is on their side. A breakout looks imminent. The only question is what kind of follow-through buying it will entail?
Thanks for reading!
