
In early April, the S&P 500 (2080.73) is rejected by a July 2015 declining trend line. After a subsequent slight pullback, the index reenergizes itself and goes for that resistance again. Last Thursday, it succeeds (Chart 1). But is the push strong enough to qualify for a breakout? It is a breakout alright, but ever so slightly.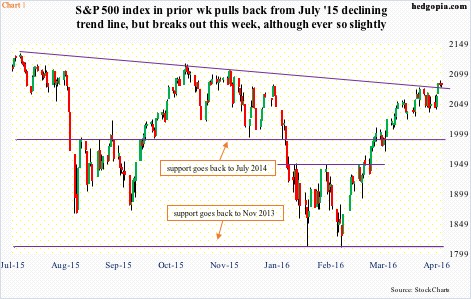
A bigger question is, can equity bulls build on it? The short answer is, maybe, maybe not. Here is why.
Ever since U.S. equities reversed course on February 11th from their January swoon, resistance has fallen like dominoes, followed by breakout retest on several. The S&P 500 broke out of 1950, the 50-day moving average, 1990, the 200-day moving average, 2040, and most recently the July 2015 trend line.
For instance, after the index broke out of 2040 in late March, buyers showed up on pullback for several sessions before pushing higher.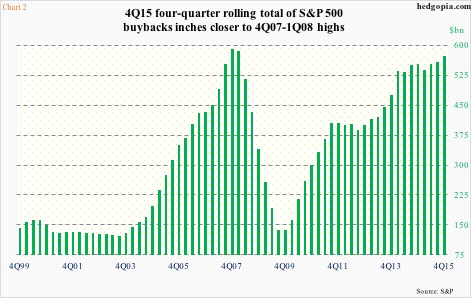
The fact that we are in the midst of an earnings season can cut both ways.
Because of blackout, buybacks are currently not a factor. They have been such a powerful force the last six years. In the midst of negative flows into U.S.-based equity funds as well as foreigners persistently selling U.S. stocks, corporate buybacks have been a steady source of buying power.
In the fourth quarter last year, a four-quarter rolling total of S&P 500 buybacks was $572 billion – the highest since $585 billion in 1Q08. The green bars in Chart 2 have persistently risen since 2009 lows.
The lack of buybacks is an equity headwind, while low-balled earnings estimates are a potential tailwind.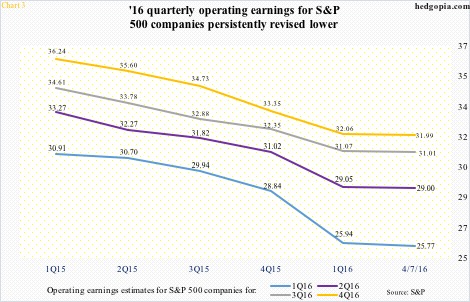
Chart 3 offers quarterly progression of operating earnings estimates for S&P 500 companies for 2016. They have been persistently revised downward, with 1Q16 going from $30.91 in 1Q15 to $25.77 now (as of April 7th). Estimates for this year have been revised all the way from $137.50 in 4Q14 to $117.78 now. This only raises the odds of companies beating or meeting estimates when they report.
We saw this unfold last week among major U.S. banks.
Post-earnings, CitiBank (C) surged 11 percent, Bank of America (BAC) 8.7 percent, JP Morgan (JPM) 7.2 percent, and Wells Fargo (WFC) 2.5 percent. Even though on a year-over-year basis, earnings fell for all four – C’s was down 27 percent, BAC’s 16 percent, JPM’s seven percent, and WFC’s five percent.
The reason for the beat? Ahead of earnings release, analysts were expecting even sharper drop. BAC’s, for example, went from $0.32 three months ago to $0.20, enabling the bank to beat by a penny.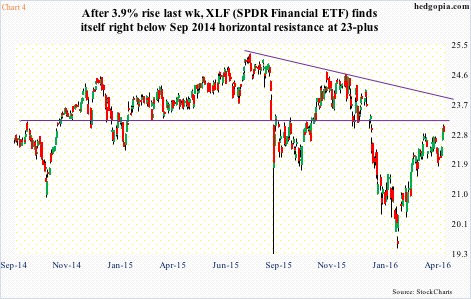
As a result, XLF, the SPDR financial ETF, had a big week last week, up 3.9 percent. A word of caution: even after this move, and the 19–percent jump since February 11th, the ETF is yet to break out of resistance at $23-plus going back to September 2014. A breakout here would be met by another resistance at just under $24 (Chart 4).
That said, there was some serious buying interest last week.
This is the yang of U.S. equities’ yin-yang equation.
The yin? Perhaps crude oil, among others.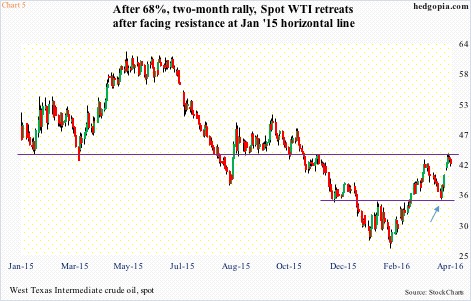
Off February 11th intra-day low, spot West Texas Intermediate crude ($41.75) rallied 68 percent in two months, in the process breaking out of $34.50-$35 on March 4th, followed by a successful retest a month later (arrow in Chart 5). A resulting slingshot move took the crude past its 200-day moving average and right into January 2015 horizontal-line resistance, also tagging the upper Bollinger Band. If there was ever a time to pause/reverse, this was it.
The WTI remains overbought on both a daily and weekly chart. And the failed Doha talks will probably be taken as an excuse to sell. Since at least February 11th, which is when stocks bottomed as well, the two have moved in tandem, give and take. Would the S&P 500 be able to break this correlation?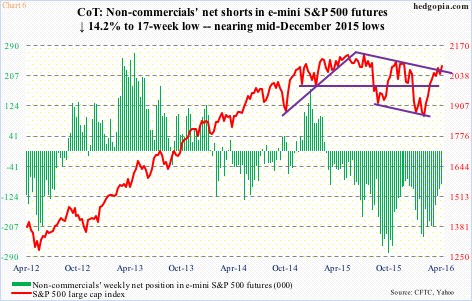
Bulls hope non-commercials continue to unwind net shorts in e-mini S&P 500 futures. As of Tuesday last week, they reduced holdings by another 14 percent to a 14-week low. The S&P 500 rallied 1.6 percent last week. Since February 9th, net shorts have declined 62 percent (Chart 6), and we know how stocks fared during the period.
With each weekly drop, the fuel for squeeze runs dry. Currently, these traders’ net shorts are 16 percent away from mid-December lows. Back then, the S&P 500 peaked before net shorts bottomed.
Also, if the dynamics between offensive versus defensive sectors are any indication, then odds of a major squeeze are low.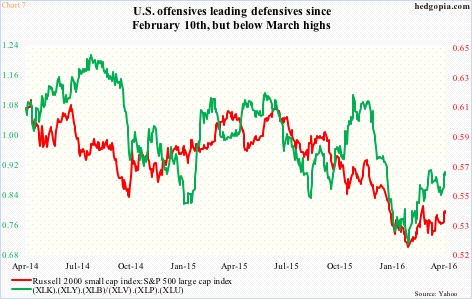
Chart 7 presents two ratios – one, the ratio of the Russell 2000 small cap index to the S&P 500 large cap index, and two, the ratio of a product of XLK (the SPDR technology ETF), XLY (the SPDR consumer discretionary ETF), and XLB (the SPDR materials ETF) to a product of XLV (the SPDR health care ETF), XLU (the SPDR utilities ETF), and XLP (the SPDR consumer staples ETF).
The numerator in both ratios signify risk-on. As could be expected, they began rising off February 10th lows, but have already peaked even as indices are near recent highs. Risk-off in progress in a very subtle way?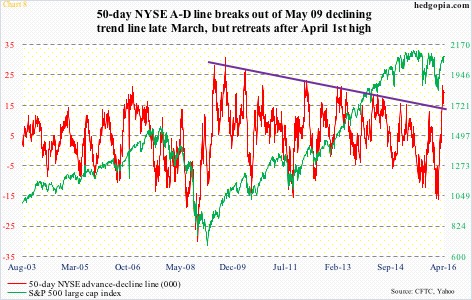
That said, things are probably not going to fall apart any time soon either. The NYSE 50-day advance-decline line just broke out of a May 2009 declining trend line (Chart 8). This is potentially a huge deal, with a caveat. After it broke out in March, it peaked on April 1st, and has more or less gone sideways since – perhaps justifying the ‘maybe, maybe not’ answer in the opening paragraphs above.
Thanks for reading!
