
The S&P 500 large cap index lost 1.3 percent last week. Intra-day, off the April 20th high through last Friday’s low, it is now down 2.8 percent. The index retreated after unsuccessfully trying to break out of a declining trend line drawn from the May 2015 all-time high (Chart 1).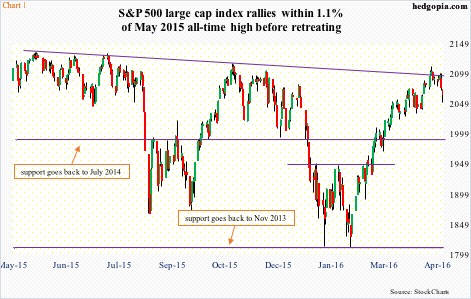
This could prove to be an important development.
April turned out to be an anticlimax – starts with a bang but ends with a whimper. The S&P 500 rose 0.3 percent in the month…was up as much as 2.5 percent at one point. Utilities, consumer staples, and technology were mainly responsible for the poor performance, with XLU, the SPDR utilities ETF, down 2.4 percent, XLP, the SPDR consumer staples ETF, down 1.4 percent, and XLK, the SPDR technology ETF, down five percent.
Technology took a heavy beating in April. The Nasdaq 100 index dropped 3.2 percent. The Dow Industrials did better, up 0.5 percent, and the Russell 2000 small cap index up 1.5 percent. But both closed substantially off the highs.
The S&P 500 would have fared even worse if not for the dollar index, which dropped 1.6 percent in April. This helped commodities rally, among others. Spot gold was up 4.9 percent. Spot West Texas Intermediate crude soared 20.7 percent. And XLE, the SPDR energy ETF, jumped 9.1 percent.
Viewed from this perspective, where the dollar goes from here will have huge implications.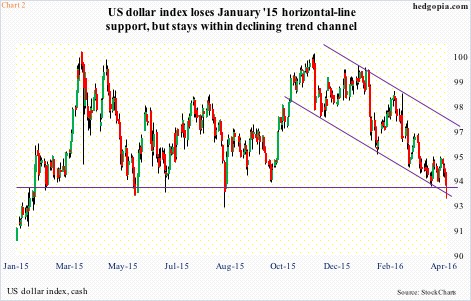
The dollar index peaked in March last year. That high was tested in November – unsuccessfully. Then it began to come under pressure, with four of the past five months in the red.
Importantly, in the wake of the Bank of Japan’s decision last week not to add stimulus, the dollar index (93.03) broke down, albeit only slightly. It lost support at 93.50 (Chart 2). On a weekly chart, technicals are grossly oversold. As well, it is at the bottom of a five-month channel. It is crunch time.
The dollar index’s next major move will reverberate through U.S. exports, corporate earnings, crude oil, and what not.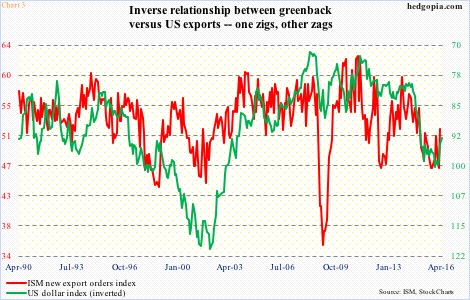
Chart 3 plots the ISM manufacturing new export orders index against the dollar index. The latter is inverted to drive home the inverse relationship between the two. Between January 1990 and March 2016, the correlation coefficient between the two was minus 0.39 – not very strong but decent.
In March, the ISM exports index rose 5.5 points month-over-month to 52, after two straight sub-50 readings. In 11 of the past 15 months, the red line in Chart 3 has been sub-50. Once again, the dollar index pretty much went sideways until 2016 began. Thus far, the decline has not had any meaningful impact on exports, nor on corporate earnings.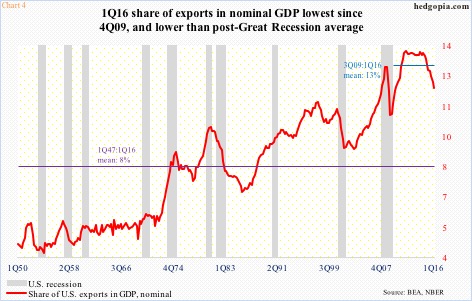
In 1Q16, U.S. nominal GDP was $18.2-trillion strong, and exports of goods and services $2.17 trillion. The latter peaked in 3Q14 at $2.36 trillion. As a percent of GDP, exports’ share was 11.9 percent in 1Q16 – the lowest since 11.8 percent in 4Q09 (Chart 4). This is still higher than the 1Q47-1Q16 average of eight percent, but much lower than the post-Great Recession mean of 13 percent.
One look at Chart 4, and it is easy to see why exports play such an important role in the U.S. economy. Historically, a sustained drop in the red line has accompanied a recession. The path taken next by the dollar index can dictate matters.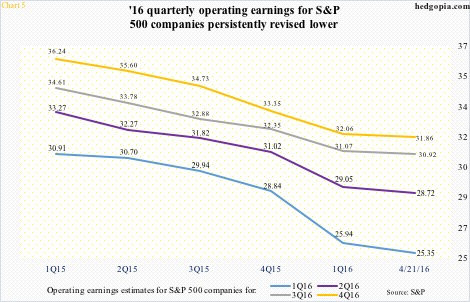
Ditto with earnings, particularly of U.S. multinationals. Chart 5 shows the progression of revision of quarterly operating earnings estimates for S&P 500 companies this year. They are all headed down.
In fact, at the end of 4Q14, 2016 was expected to earn $137.50 (not shown here), which have now been slashed to $116.84. This would still mark a healthy increase over $100.45 in 2015, estimates for which were as high as $137.50 at the end of 2Q14.
The point is, it has been customary to have lofty expectations at the beginning, and then see estimates persistently revised lower. The dollar has been partly responsible for this. Beginning July 2014 through the afore-mentioned March 2015 high, the dollar index surged 25-plus percent. In a mere nine months!
Hence the significance of which way it is headed next.
As things stand now, the second half this year is expected to do the heavy lifting, with 3Q16 and 4Q16 expected to annually rise 21.5 percent to $30.92 and 38.2 percent to $31.86, respectively (as of April 21st). A lot of this optimism is pinned on the dollar index, which since the March 2015 peak has gone sideways to down.
Looking at 2017 estimates of $135.27, revised lower from $141.11 three months ago, the sell-side hope is that the dollar index continues to behave going forward,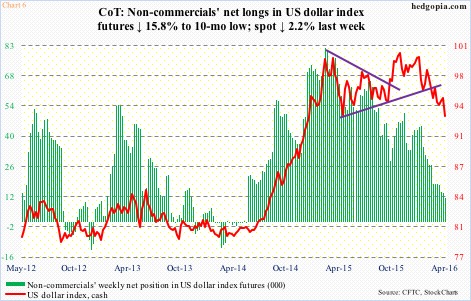
Thus far, that is also the message coming from non-commercials’ net longs in US dollar index futures. As of Tuesday last week, holdings were at a 10-month low (Chart 6). Incidentally, back in March last year, peak in net longs coincided with peak in the US dollar index. If and when they switch their bias and start adding to net longs, that will be a development worth watching. Further, it will be interesting to see how these traders reacted to the Friday breakdown last week.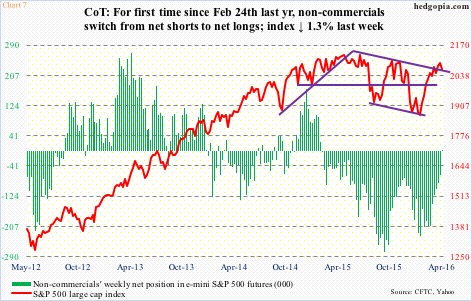
Speaking of which non-commercials have done quite an about-face when it comes to how they are positioned as relates to e-mini S&P 500 futures. For the first time since February 24th last year, they are now net long (Chart 7). It is only 1,460 contracts, but symbolically it is huge.
In the week ended February 9th, they were net short 234,321 contracts. The index bottomed on the 11th that month (Chart 1). The resulting squeeze went a long way in the nearly 17-percent rally in the index. That fuel is no more.
Yes, short interest on an index level (both NYSE composite and Nasdaq composite) is still high, but on a company or ETF level, it has gone down quite a bit since the rally got underway 11 weeks ago.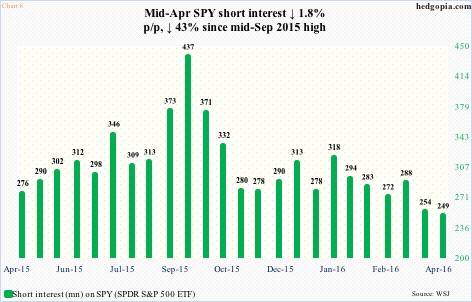
On SPY, the SPDR S&P 500 ETF, for example, short interest has been in decline since the middle of September last year. From February 12th through April 15th, it dropped 12.6 percent, to 249.4 million – the lowest since the end of March last year (Chart 8). What was once a tailwind for stocks is turning into a potential headwind.
The same way margin debt was once a tailwind but now a headwind.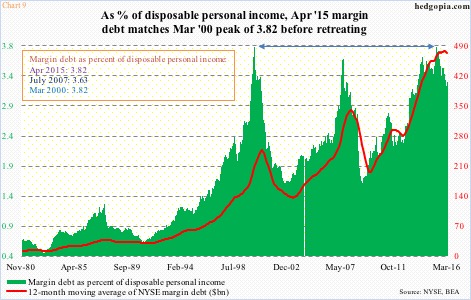
NYSE margin debt rose $10 billion in March to $445.8 billion. This was the first month-over-month increase in four months. However, an increase of a mere $10 billion in a month in which the S&P 500 rallied 6.6 percent speaks volumes about whether or not traders view the current environment as risk-on. Margin debt has dropped $61.3 billion from the April 2015 peak. As a percent of disposable personal income, that peak matched the March 2000 peak of 3.82 (Chart 9). There is plenty of unwinding left still.
This, combined with the S&P 500’s rejection at the May 2015 trend line, potentially is an important development. For now, it wants to go lower, that is for sure. If the dollar index bucks the trend and goes the other way (Chart 2), that can amount to yet another headwind for stocks. There is support at 92 and change.
Thanks for reading!
