
After the drubbing stocks took post-ECB disappointment last Thursday, bulls could not have asked for better reaction on Friday.
Stocks in general recouped Thursday’s loss, and then some.
The S&P 500 index rallied 2.1 percent on Friday (Chart 1), in the process taking back its 200-day moving average, which was lost just a day earlier.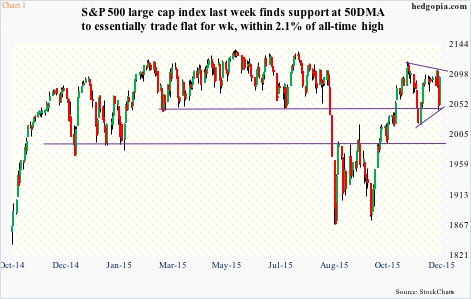
Call it investor urge to play favorable year-end seasonality or genuine desire to own stocks, bulls’ ability to fight right back and defend important support should be commended.
On the S&P 500, amidst heavy selling on Thursday, buyers defended the rising 50-day moving average. On the Nasdaq 100, the 4560 level drew buyers; this support goes back to April this year (Chart 2). And on the Dow Industrials, 17400 was defended.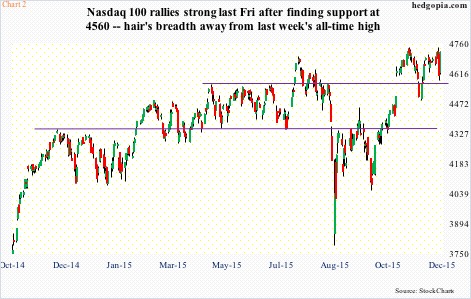
While from bulls’ perspective, this should bode well in the days and weeks ahead, a deeper look reveals they have not been winning hands down. Far from it!
Staying with the S&P 500 for a moment, since October 23rd, the 200-DMA has been won and lost five times on a closing basis. Even more interesting, here are weekly closes for the past three weeks: 2089.17, 2090.11 and 2091.69. Meaning the index has only marked time during this period.
This is also a time non-commercials’ net shorts in e-mini S&P 500 futures went from 125,782 contracts to 96,379 (Chart 3). Ordinarily, this should have helped stocks, and it probably did. But the fact that stocks only treaded water in these three weeks also suggests the presence of strong selling pressure.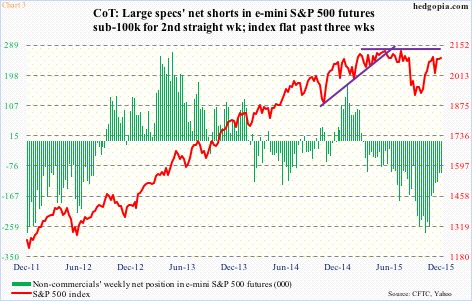
Both camps are not willing to give an inch. It is only a matter of time this tie gets broken.
For now, despite the strong move in stocks since the September 29th low, there have not been boatloads of inflows. Since September 30th, inflows into U.S.-based equity funds have only totaled $10.8 billion (courtesy of Lipper).
On the other side of the spectrum, bears probably have themselves to blame. Going into the September 15th period, short interest on SPY, the SPDR S&P 500 ETF, spiked to 436.7 million shares. Then stocks bottomed, squeezing the shorts. Short interest has dropped 36 percent since.
In this context, it is tough to argue the rally since September 29th is all organic in nature. Short interest helped, and flows have not improved much.
Depending on if inflows improve – or margin debt picks up for that matter – we will find out if it is a pause that refreshes itself or will fizzle out soon. This will also decide if Charts 4 or 5 will prevail in the days and weeks to come.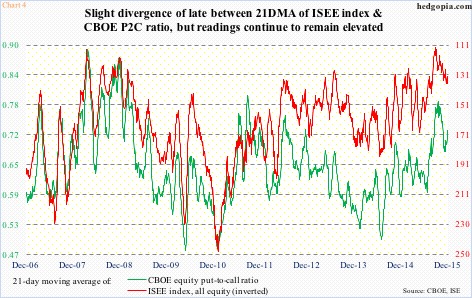
In Chart 4, a 21-day moving average of both the CBOE put-to-call ratio and the ISEE index (equity) has been calculated. The latter is a call-to-put ratio, hence inverted. As can be seen, leading up to late-August lows in stocks, there was a major spike in both the green and red lines. By nature, as these conditions get unwound, stocks get a tailwind. This phenomenon is already unfolding as expected, and probably has a long way to go still if past is any guide.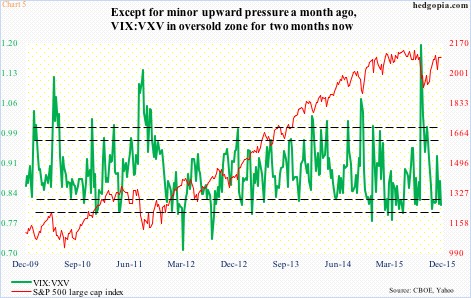
Then we have Chart 5, which is sending a contrasting message. The VIX to VXV ratio is screaming caution for stocks. Except for a reading in the .90s early last month, the green line has been stuck in the .80s for nine straight weeks – suggesting complacency. What this means is that demand for protection going out a month is way cheaper than those going out three months. When this reverses, stocks tend to run into a headwind.
If we were to use small-caps as a measuring stick for investor willingness to take on risk, there is a definite caution in the air.
The 1210-1215 level on the Russell 2000 index has proven to be an important price point going back to March last year – sometimes acting as support, other times resistance. Since it lost that support in the August sell-off, the index tried twice but failed on each occasion to take that ceiling out. In fact, until recently, the Russell 2000 struggled at lower resistance – 1170 (Chart 6).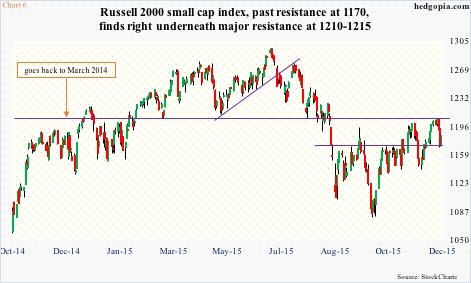
Two weeks ago, small-cap bulls finally took care of the 1170 resistance, followed by a rejection at the March 2014 resistance. The subsequent sell-off had buyers one again show up at 1170 last Thursday. The positive in all this? The 1170 level did not give way. The negative? That it was getting tested again even as 1210-1215 is acting like it is invincible.
There are similar mixed messages everywhere you look. The next few sessions will probably decide which way things will trend in the near-term.
After Friday’s action, it is bulls’ ball to lose. The S&P 500 in particular has carved out a pennant (Chart 1), which more often than not tends to be a continuation pattern. Let us see if they can force a breakout.
Thanks for reading!
