
Jackson Hole came and went.
At the annual confab, Janet Yellen, Fed chair, last Friday seemed to agree with preceding hawkish messages from three prominent FOMC members – Stanley Fischer, vice-chair, William Dudley, New York Fed president, and John Williams, San Francisco Fed president. That said, she also emphasized data dependency – the usual middle-of-the-road message.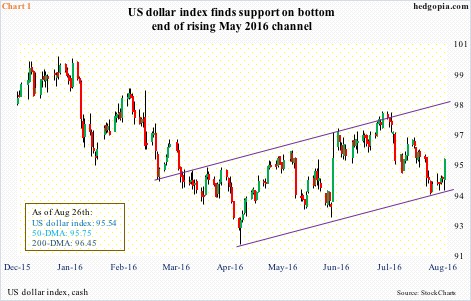
Predictably, Friday produced a choppy session. The S&P 500 large cap index fell 3.43 points but intra-day swung in a 28-point range. Spot VIX swayed between 14.93 and 12.13 before essentially closing flat. The US dollar index had a similar wild ride, oscillating between 94.20 and 95.58 before closing near session high 95.54 (Chart 1). The two-year Treasury yield – most sensitive to interest rate expectations – rallied six basis points to 0.84 percent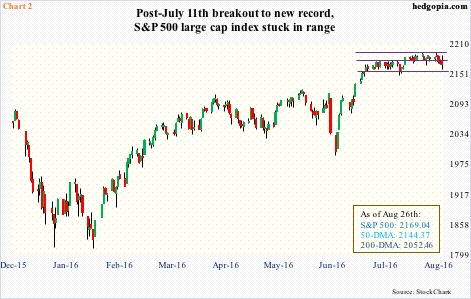
Despite the bump in rates, the S&P 500, and other major U.S. indices, held their ground. The S&P 500 is still stuck in the one-month range it entered following the July 11th breakout … last Friday, 2160 held but 2175, which also approximates the 20-day moving average was lost (Chart 2).
This comes on the heels of two back-to-back weekly dojis. Odds favor the index continues to come under pressure near term. The 50-day moving average is 1.1 percent away, and the 200-day, which is flattish, 5.4 percent away.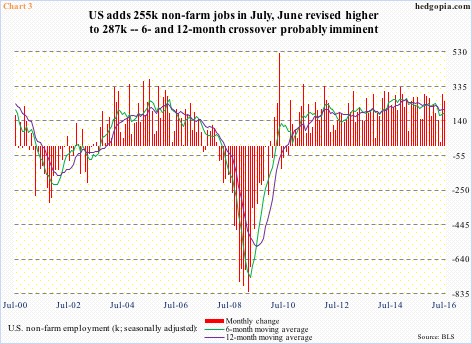
Until September 20-21, when the FOMC next meets, markets are bound to be on pins and needles. August’s jobs report, scheduled for this Friday, has taken on a new significance.
Mr. Fischer, in a CNBC interview after the Yellen speech, suggested that the jobs report would weigh in on their decision. If August’s numbers are anywhere near June and July (Chart 3), they would now need some really good excuse not to move.
July saw an increase in non-farm payroll of 255,000. At 292,000, June was even stronger. In Chart 3, the six-month moving average crossed under the 12-month in March 2015, and has remained under in 13 out of last 17 months. Of late though, both averages have hooked up. A crossover is possible in due course if recent momentum sustains. Hence August’s significance.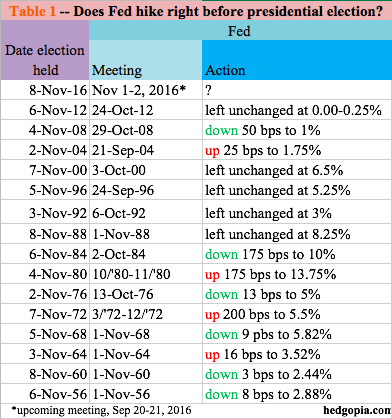
One primary reason behind those arguing the Fed is likely to stand pat in the September meeting is the upcoming November 8th U.S. presidential election.
In fact, as Table 1 shows, of the prior 15 presidential elections, the Fed cut rates six times, left them unchanged five times, and raised them at least twice and possibly four times.
Most recently, in 2004, in the June 30th meeting the Fed hiked by 25 basis points to 1.25 percent, then kept hiking. The election was on November 2nd that year, with the Fed hiking both before and after. On September 21st, the rate was pushed up by 25 bps to 1.75 percent.
Evidently, the Fed does move before election, if the need be.
This time around, September also has a post-meeting press conference scheduled by the chair. The remaining other two meetings are November 1-2 and December 13-14. Mr. Fischer in the afore-mentioned Friday interview said two rate hikes were possible this year. If they deliver on this and if August’s employment report is strong, September is a safe bet, although markets are yet to price it in.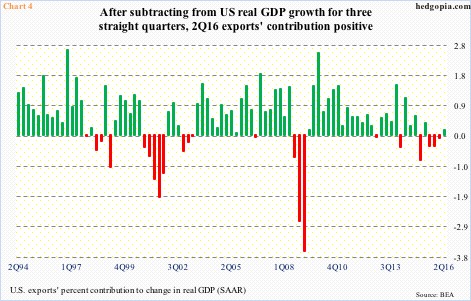
In this scenario, the dollar index can continue to rally, to at least the upper end of the channel it is in, which lies around 98.50 (Chart 1). This still falls short of the March 2015 high of 100.71, which was later unsuccessfully tested in November (100.60). A breakout can have immense repercussions for U.S exports, corporate profits, and what not.
Prior to the March 2015 peak and the subsequent range-bound action, the dollar index rallied north of 25 percent in nine months. Accordingly, exports peaked at a seasonally adjusted annual rate of $2.15 trillion in 4Q14, dropped to $2.1 trillion in 1Q16, before rising a tad to $2.11 trillion in 2Q16. After three successive quarters in which exports subtracted from real GDP growth, 2Q16 contributed a tiny 0.14 percent.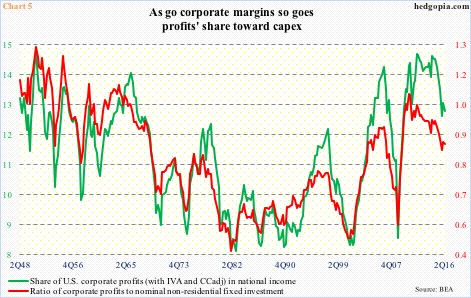
Likewise, corporate profits adjusted for inventory and depreciation peaked at a seasonally adjusted annual rate of $2.22 trillion in 4Q14, before dropping to $1.97 trillion four quarters later. Profits fell 1.2 percent quarter-over-quarter to $2 trillion in 2Q16 – fifth q/q drop in last six quarters. This has direct impact on capital expenditures.
Nominal non-residential fixed investment peaked at a seasonally adjusted annual rate of $2.33 trillion in 3Q15; 2Q16 was $2.29 trillion. Margins have weakened, as has capex.
The bottom line: the dollar index cannot afford to rally much. The Fed knows this. The markets know that the Fed knows this. A hike or two would probably not result in the dollar index breaking out of the range, but continued hawkish message might.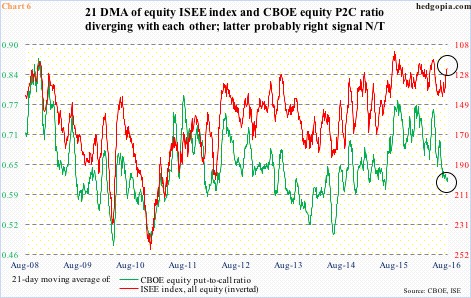
For now, confusion reigns – evident in how various asset classes traded last Friday. And evident in Chart 6, which plots the equity CBOE put-to-call ratio with the ISEE index, all equity (more on this here). (The latter is inverted.) In normal circumstances, they tend to move together. Now, they are diverging, with the latter showing more put-buying and the former more call-buying.
Given where equity indices are in currently and the overbought conditions they are in, the green line in Chart 6 has probably got it right – at least near term. It inched up the past couple of sessions, and has tons of unwinding left.
Thanks for reading!
