
U.S. corporate bond issuance this year bolted out of the blocks in a strong fashion.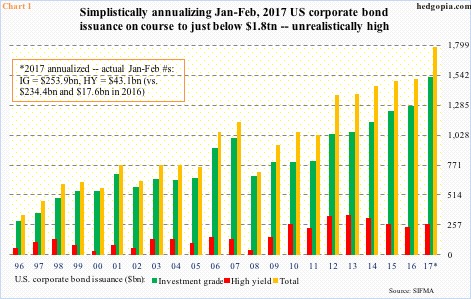
In January and February, issuance totaled $296.9 billion, versus $252 billion in the corresponding period last year. High-yield, in particular, has had impressive issuance – $43.1 billion this year versus $17.6 billion last year. Investment-grade was $253.9 billion, versus $234.4 billion.
Accordingly, if we annualize January and February, 2017 is on pace to issuing $1.78 trillion, and high-yield would have grown after three consecutive down years (Chart 1). It is possible high-yield will have a positive 2017, but it is next to impossible for total issuance to grow 18 percent. Last year, issuance rose 1.4 percent, and 2.6 percent before that.
Corporations issued north of $1 trillion in each of the past seven years, totaling $9.2 trillion.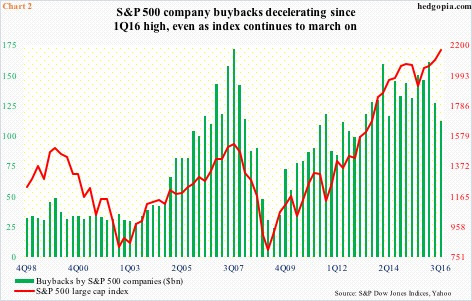
How issuance fares this year can have implications for corporate buybacks. The latter has been a source of big support for stocks.
The S&P 500 large cap index bottomed in March 2009. Buybacks by the constituent companies bottomed in 2Q09 at $24.2 billion, peaking at $161.4 billion in 1Q16, before dropping for the next two quarters (Chart 2).
It is possible 4Q16 buybacks did not improve much. Numbers are not out yet.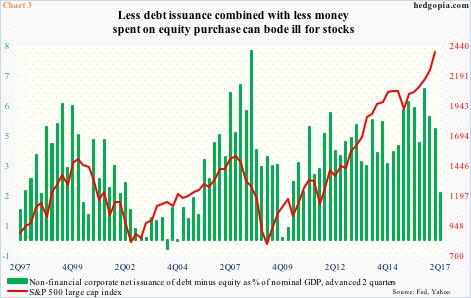
We do know this. In 4Q last year, corporations averaged $87.3 billion in monthly bond issuance, with December merely $61 billion, versus a monthly average of $126.7 billion in all of 2016. This matches with net funds raised by non-financial corporate business (from the Fed’s Z report).
In 4Q16, these corporations only raised $59.5 billion in debt (seasonally adjusted annual rate), down from $224.6 billion in 3Q, $327.9 billion in 2Q and $570.5 billion in 1Q. Notice the decelerating trend.
In the meantime, equities were a drain on funds – obviously – meaning they were purchased. In 4Q last year, $322.9 billion (SAAR) was spent, versus $666.8 billion in 3Q, $652.4 billion in 2Q, and $620.6 billion in 1Q. The 4Q drop is noticeable.
Chart 3 combines both these – equity is subtracted from debt on a net basis and then use the number to calculate a share of nominal GDP. In 4Q16, for instance, [($59.5bn)-(-$322.9bn)/$18.9tn] gets us 2.03 percent, much smaller versus 6.5 percent in 3Q16, which is what the green bars represent. They are contracting. If past is prelude, the red line should follow these bars lower. The latter has been advanced by two quarters.
Long story short, Chart 3 is telling us to expect a decent drawdown in the weeks/months to come. Fingers crossed.
Thanks for reading!
